-Evidence Remains Bullish For Stocks
-Weak Dollar Helps Stocks and Commodities
-Major index ETFs Hit New Reaction Highs
-Breadth Remains Bullish Overall
-Small-caps Leading Large-caps
-Nasdaq Lagging NY Composite
-Stocks: ACS, ADSK, APD, ATVI, DVN, HRB, RTN, S, VZ
-Link to today's video (click here)
-Next update: September 15th (Tuesday) around 7AM ET.
*****************************************************************
Stock Market Overview
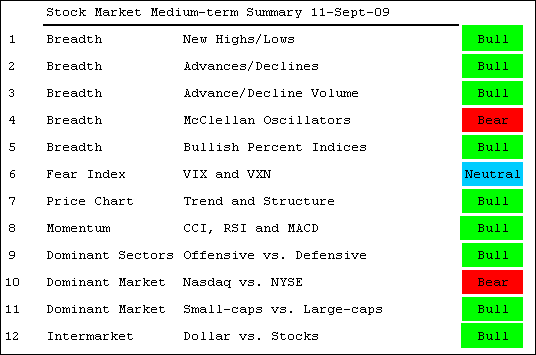
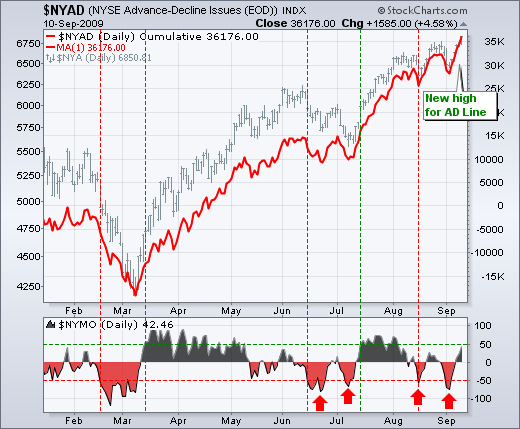
The bulk of the medium-term evidence remains bullish for stocks. The major index ETFs pushed above their August highs with a sharp rally this week. Breadth remains bullish overall as the AD Lines and AD Volume Lines also pushed to new highs for the move. Offensive sectors (consumer discretionary, finance and technology) continue to lead defensive sectors (healthcare, utilities and consumer staples). Small-caps are also leading large-caps. The negatively correlated US Dollar Index remains in a downtrend to further boosts the argument for stocks. For your viewing pleasure, I have constructed a table of key stock market indicators. According to my analysis, 9 of the 12 are in bull mode to keep the stock market medium-term bullish. Until the majority of these turn bearish, we should expect higher stock prices over the foreseeable future. In other words, the trend is in place until proven otherwise.
*****************************************************************
Intermarket Overview
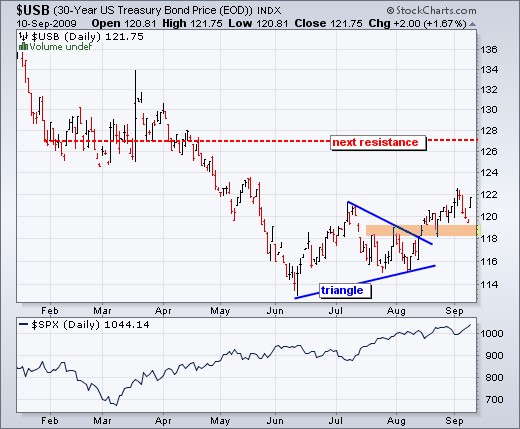
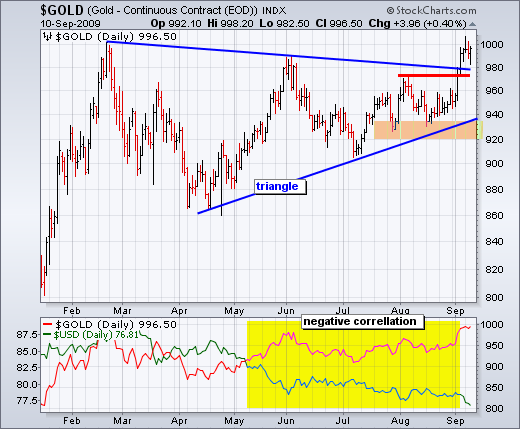
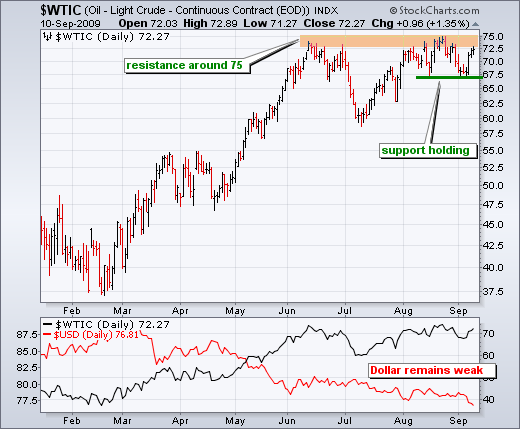
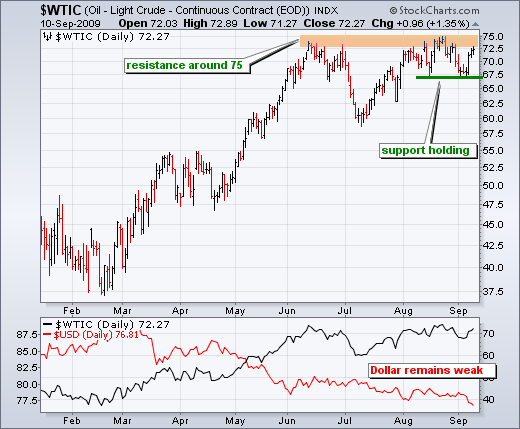
There are no changes in the intermarket picture. Gold broke the $1000 barrier this week to remain in bull mode. Conversely, the US Dollar Index broke to new lows for the year to affirm its downtrend. Continued weakness in the greenback is boosting stocks and commodities. Oil surged over the last three days, but lags gold and has yet fully embrace the Dollar weakness. Even though this is a concern, oil has yet to actually break down or reverse its uptrend. After four consecutive down days, bonds surged on Thursday to keep their uptrend alive.
*****************************************************************
New Reaction Highs
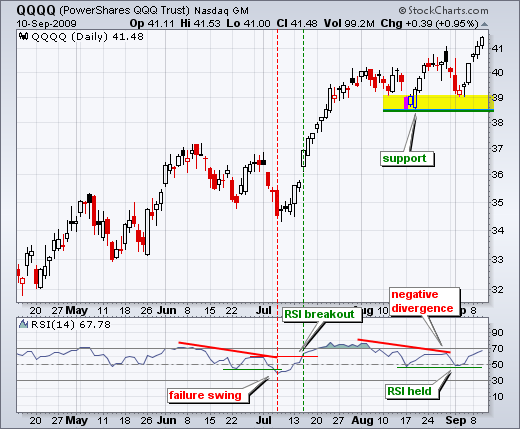
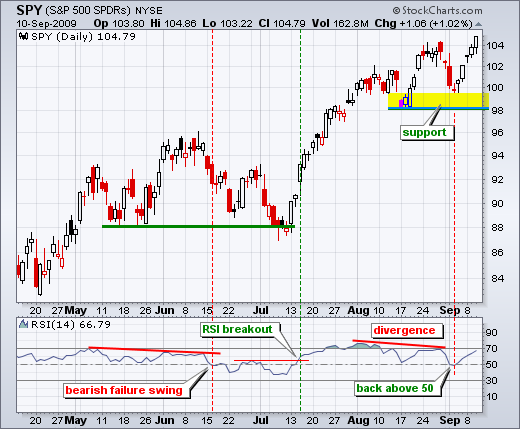
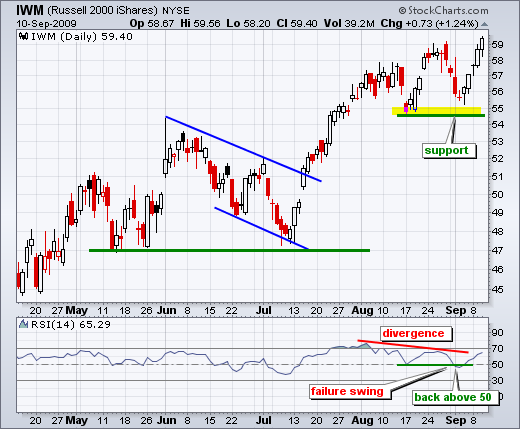
QQQQ, SPY and IWM all moved above their August highs to forge higher highs. These September highs mark new highs for the current advance. New reaction highs affirm the current uptrend. Key support levels are marked by the August-September lows. I continue to show RSI for all three. RSI formed negative divergences in August and dipped below 50 for SPY and IWM. However, RSI for QQQQ held above 50 and above its August low. With the surge over the last five days, RSI is back near 70 and nearing overbought levels again.
*****************************************************************
Breadth Is Bullish Overall
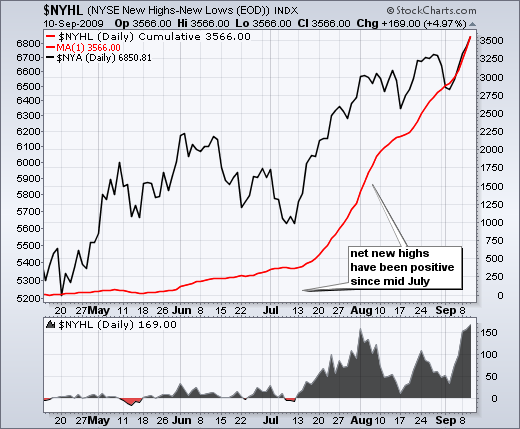
Despite weakness in the McClellan Oscillators, breadth should be considered bullish overall. Remember, the McClellan Oscillator is a momentum indicator for Net Advances. As an oscillator, it will have characteristics similar to other momentum oscillators (MACD, RSI). It is important that we also keep an eye on the purer breadth indicators, such as the AD Line and AD Volume Line. Analytically, it may help to think of the AD Line as the main indicator and the McClellan Oscillator as a momentum oscillator of the AD Line - similar to SPY and MACD for SPY. With the AD Lines and AD Volume Lines for the Nasdaq and NYSE hitting new highs, breadth must be considered bullish overall. In addition, Net New Highs remains firmly positive for both the Nasdaq and NYSE.
*****************************************************************
Dominant Markets are Split
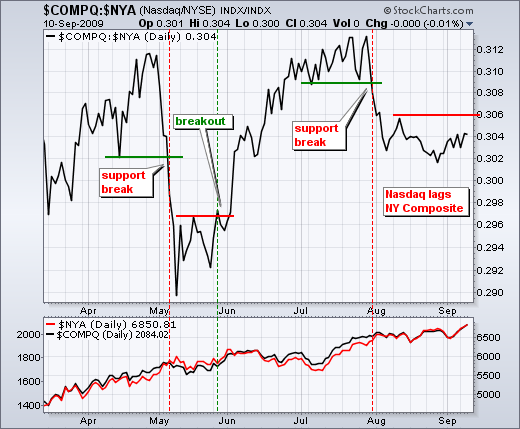
Ideally, the Nasdaq should lead the NYSE during an advance. In addition, small-caps should lead large-caps. This is because small-caps and technology stocks represent the high-risk end of the market. Bull runs are strong when the appetite for risk is strong. While small-caps are holding up their end of the bull bargain, the Nasdaq is falling a bit short. The Nasdaq/NY Composite ratio broke support in late July and remains under pressure. This means that the Nasdaq is lagging the NY Composite. A break above .306 is needed to reverse the downtrend in this price relative.
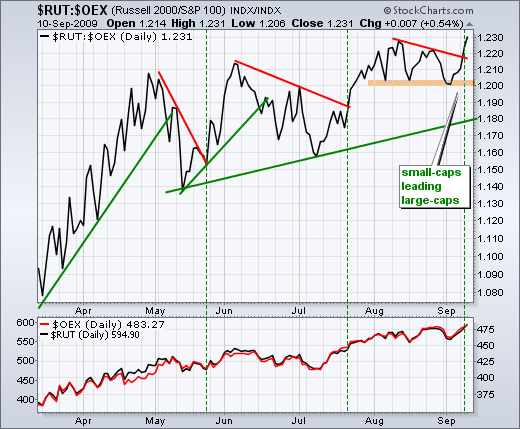
The second chart shows the Russell 2000 relative to the S&P 100 ($RUT:$OEX ratio). This price relative has been working its way higher since May. Most recently, the ratio broke above its August highs. Small-caps are in the drivers seat as long as the ratio holds support from the August-September lows.
*****************************************************************
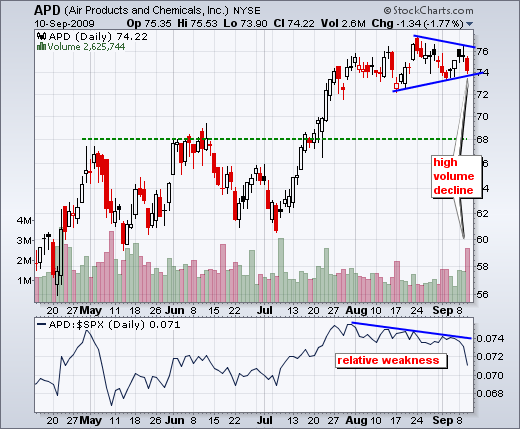
What's wrong with Air Products (APD)? The stock has been relatively weak since early August and declined with big volume on Thursday.
*****************************************************************
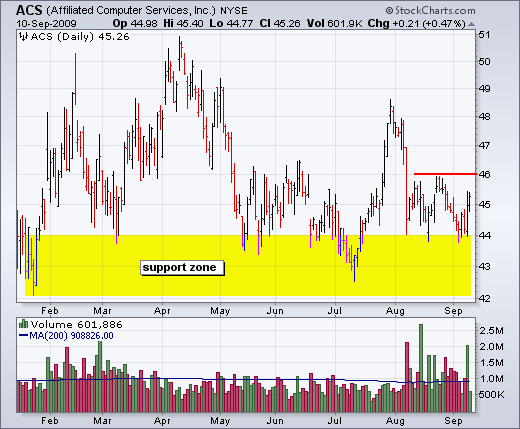
After a sharp decline in early August, Affiliated Computer Services (ACS) firmed at the top of its support zone and surged with good volume on Wednesday.
*****************************************************************
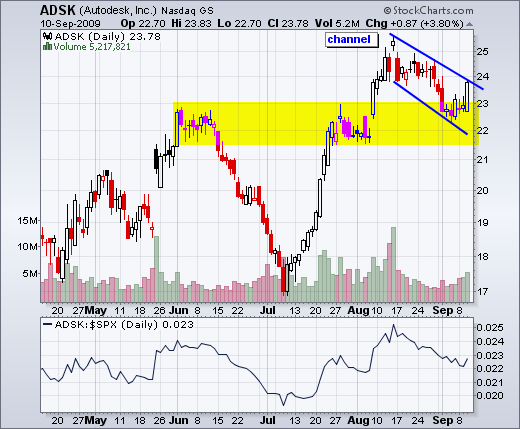
Autodesk (ADSK) corrected back to broken resistance with a channel or flag. The stock firmed last week and surged with good volume on Thursday.
*****************************************************************
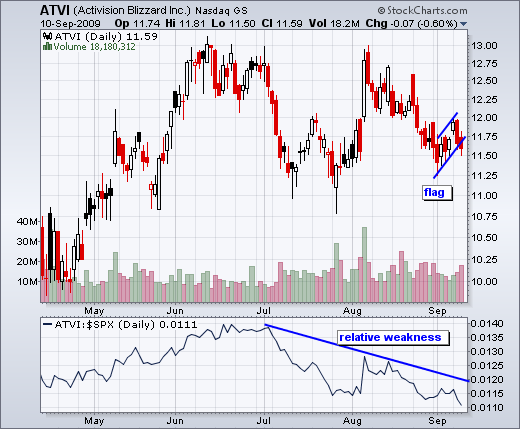
Activision (ATVI) peaked in early August, declined sharply and then stalled with a rising flag in September. The decline over the last two days broke flag support with increasing volume. Other video game makers are also under pressure.
*****************************************************************
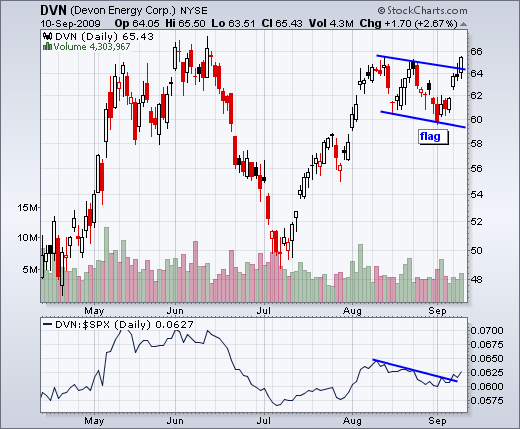
Devon Energy (DVN) broke flag resistance with four day surge. The stock is already short-term overbought, but money appears to be moving into some natural gas players.
*****************************************************************
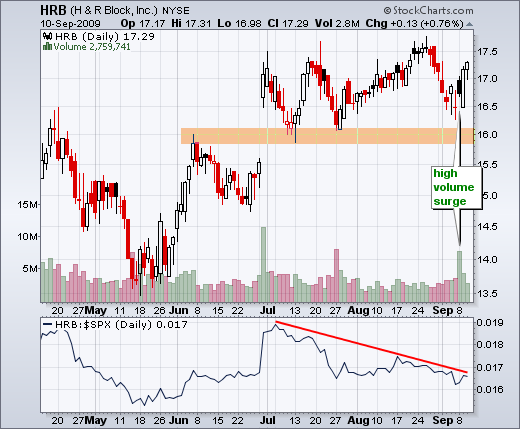
HR Block (HRB) is getting a nice bounce off support with good volume. Notice that the stock broke resistance with a big gap in late June and this gap turned into support.
*****************************************************************
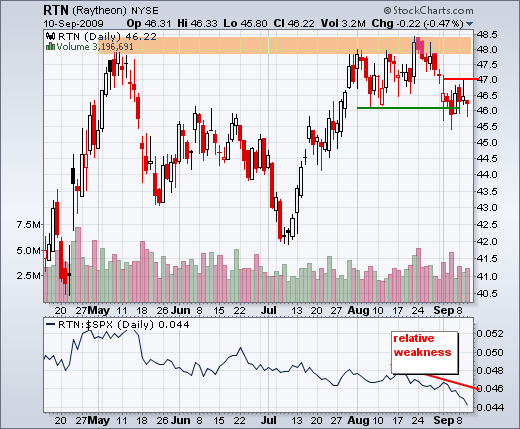
Some defensive stocks are dogging it. Raytheon (RTN) peaked in late August and broke below its August lows in early September. Volume is increasing on the downside as the stock shows relative weakness. Deficit hawks may one day turn their eye towards US defense spending.
*****************************************************************
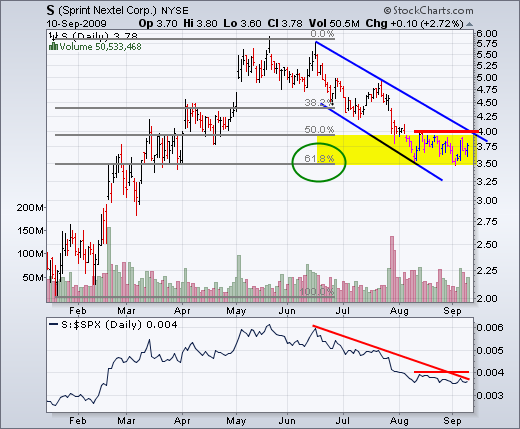
Sprint Nextel (S) has also been dogging it lately, but the stock has a potentially bullish setup in the works. You know the drill. The stock retraced 50-62% of the prior advance with a falling channel. A break above the August consolidation highs and upper channel trendline would be bullish.
*****************************************************************
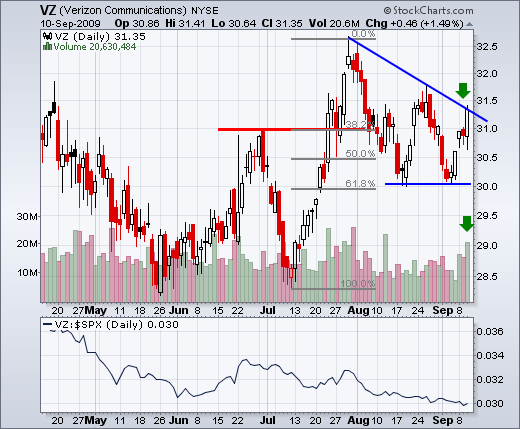
Verizon (VZ) bounced off support this week with good volume two of the last three days. Also notice that the stock bounced off the 62% retracement mark in mid August.
*****************************************************************

