-Market Overview
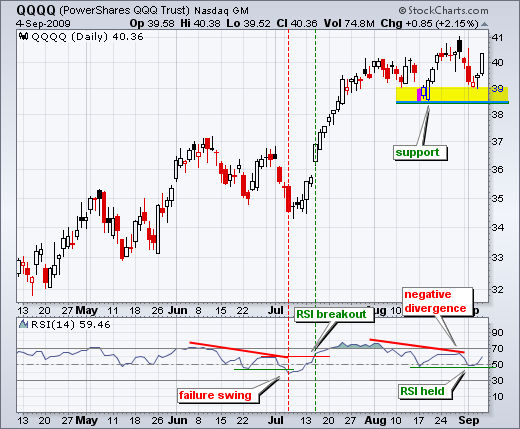
-RSI Holds for QQQQ
-August Lows Mark Key Support
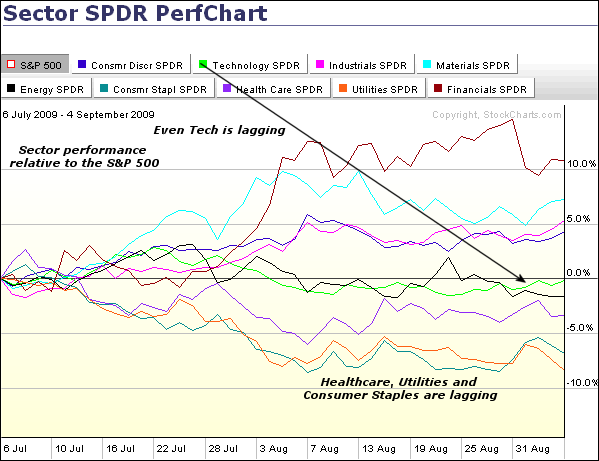
-Defensive Sectors and Technology Lagging
-XLB and XLY Hold Breakouts
-OIH forms Falling Flag
-KRE Hits Key Retracement
-IYT and IYR Bounce off August Lows
-Stocks: AA, DRI, DRYS, EXPD, RIG, SLE, XTO
-Link to today's video.
-Next update: September 11th (Friday) around 7AM ET.
*****************************************************************
Market Overview
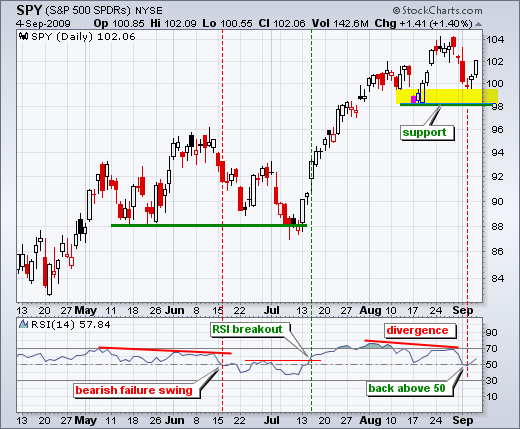
Despite some signs of deterioration in market breadth and momentum, the medium-term trends remain up for the major stock indices. Turning bearish at this point would still be a top picking exercise. With the late August surge and Friday's gains, the August-September lows now form a support zone that holds the key. In the inter-market arena, gold broke triangle resistance with a big surge last week and start a new uptrend. The Dollar remains in a downtrend, but the US Dollar Index is trying to stabilize around 78-79. West Texas Intermediate met resistance in the mid 70s at the end of August and could be forming a double top. Even so, the overall trend remains up for oil. Despite a big hit on Friday, the 20+ Year Treasury ETF remains in a medium-term uptrend.
*****************************************************************
Major Index ETFs
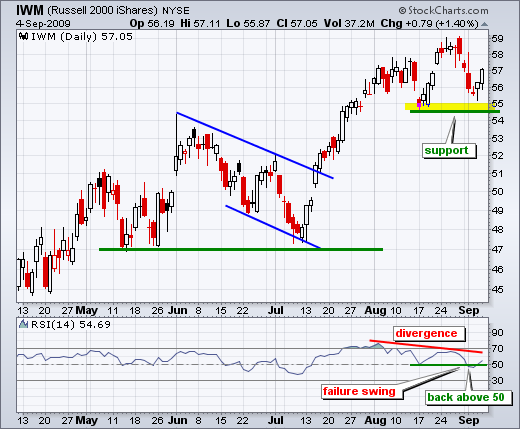
Last week I talked about the negative divergences and failure swings in RSI. These remain in place for SPY and IWM, but the overall trend on the price charts is still up. How can this be? RSI is a momentum oscillator. Even though the trend is up, the negative divergence in RSI indicates that upside momentum is not as strong as before. Even though it is waning, momentum still favors the bulls as long as RSI is above 50. With Friday's bounce, RSI moved back above 50 for the major index ETFs.
QQQQ gets its own paragraph because RSI held above its August low. This means RSI did not trace out a bearish failure swing. A bearish failure swing requires RSI to form a lower high and then break below its prior low. RSI formed a lower high in late August, but did not break its August low last week. This brings up the issue of confirmation. I think it is important that all three of the major index ETFs (SPY, QQQQ, IWM) confirm to validate signals. Here are the lines in the sand. The trend remains up as long as all three hold their August lows. Momentum remains bullish as long as RSI holds above its August low.
*****************************************************************
Sector Performance
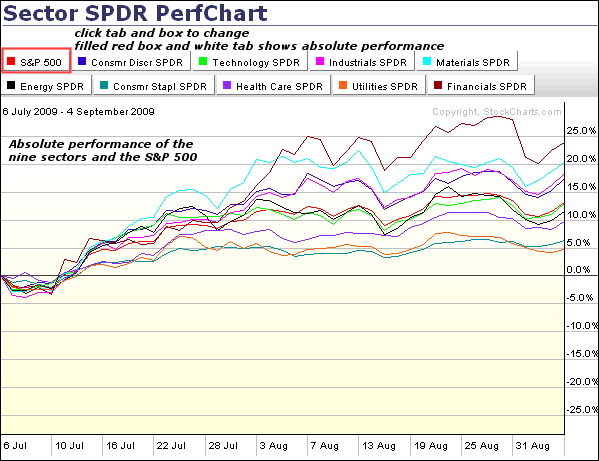
The perfchart below shows sector performance relative to the S&P 500, not absolute performance. This chart starts in early July, which is when the last advance kicked off. Sectors below the zero percent line show relative weakness. Sectors above show relative strength. As expected during a bull run, the defensive sectors show relative weakness (healthcare, utilities, consumer staples). These sectors would likely show relative strength if/when the stock market moves into bear mode. Technology and energy are the other laggards. Yes, the Technology SPDR (XLK) has been lagging the broader market. This is a negative, but we are still seeing relative strength in the consumer discretionary, industrials and finance sectors. For reference, I am also showing this same chart with absolute performance. Notice that all sectors and the S&P 500 are positive since early July. Some are just more positive than others.
*****************************************************************
XLY and XLB Hold Breakouts
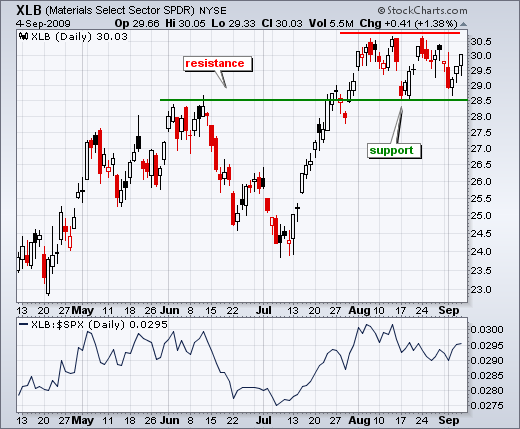
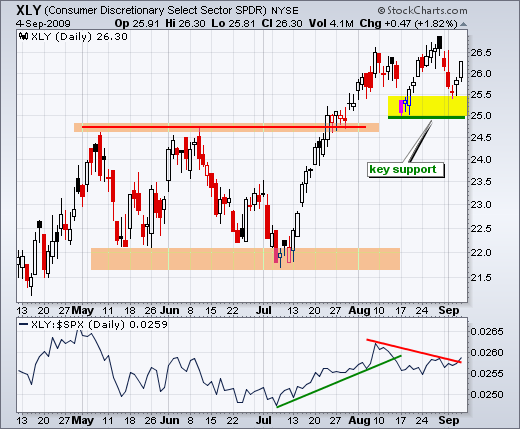
The Consumer Discretionary SPDR (XLY) and the Materials SPDR (XLB) have similar patterns at work. Both broke above their May-June highs with the July surge and broken resistance turned into support with the August lows. As with the major index ETFs, support from the August-September lows now holds the key to the current uptrends. In fact, I think it is safe to say that all nine sector SPDRs are in medium-term uptrends with the August lows marking key support.
*****************************************************************
OIH Forms Falling Flag
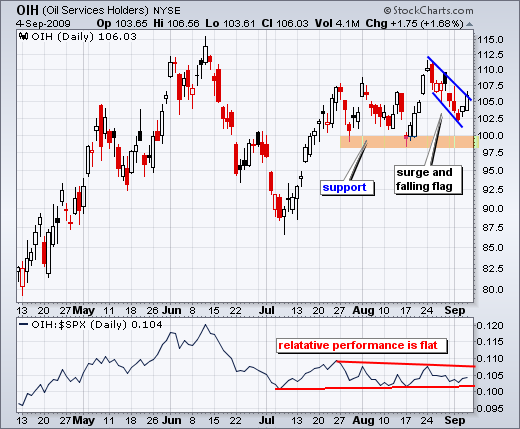
The Oil Service HOLDRs (OIH) established support with reaction lows in late July and mid August. The surge in mid August was quite strong and the ETF then formed a falling flag on the pullback. A flag breakout would be bullish and target further strength towards the June high.
*****************************************************************
KRE Enters Retracement Zone
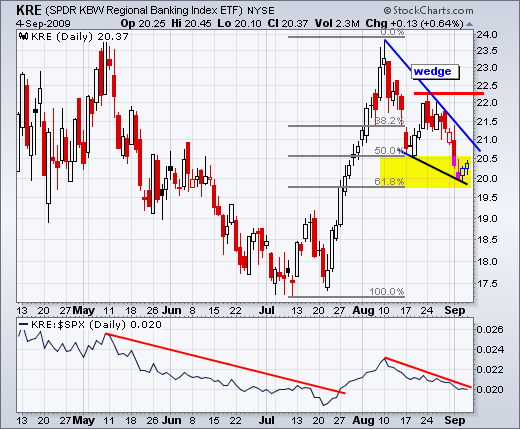
After surging to its May high, the Regional Bank SPDR (KRE) pulled back in August with a decline back to 20. This decline retraced 50-62% with a falling wedge pattern. On the bearish side, KRE showed relative weakness throughout August and this is a concern for the broader market, especially the banking group. On the bullish side, the wedge retracement is typical for corrections. KRE firmed around 20-20.5 the last three days and the moment-of-truth is nigh. It is time to bounce with the rest of the market or possible pull the finance (and broader market) down.
*****************************************************************
IYR and IYT Bounce off August Lows
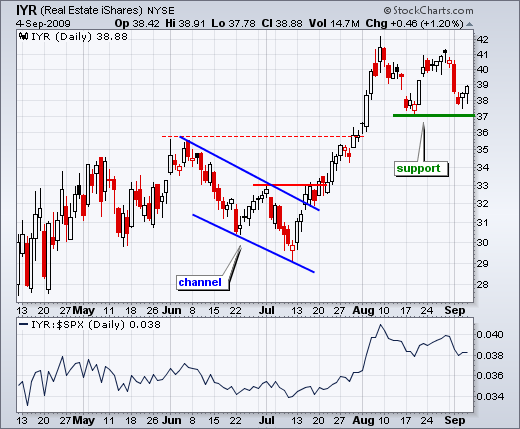
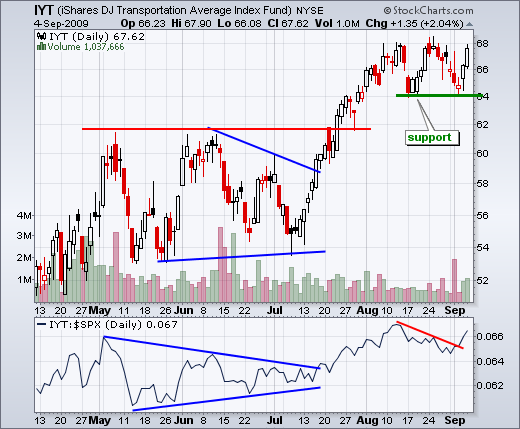
The REIT iShares (IYR) and Transport ETF (IYT) further reinforce the importance of support from the August lows. Both broke resistance in late July and early August. The ETFs then established support in mid August and both bounced off their August lows late last week.
*****************************************************************
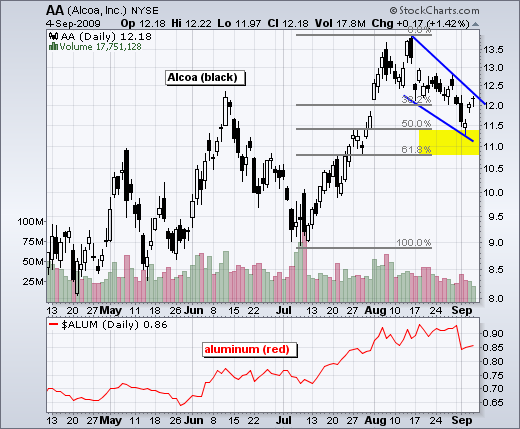
Alcoa formed a falling wedge and bounced off the 50% retracement mark with a gap up on Thursday.
*****************************************************************
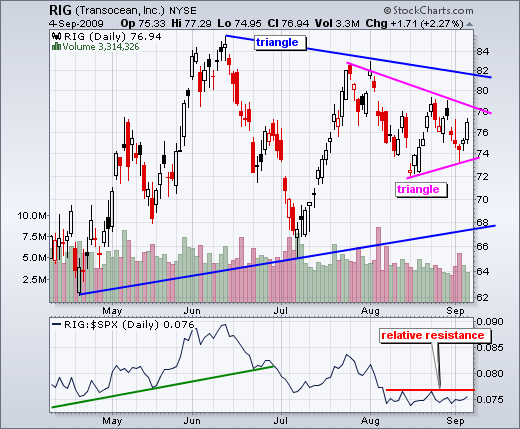
Transocean (RIG) formed a triangle within a bigger triangle. This amounts to a consolidation within a consolidation. The stock formed a hammer three days ago and then surged above 76 on Friday.
*****************************************************************
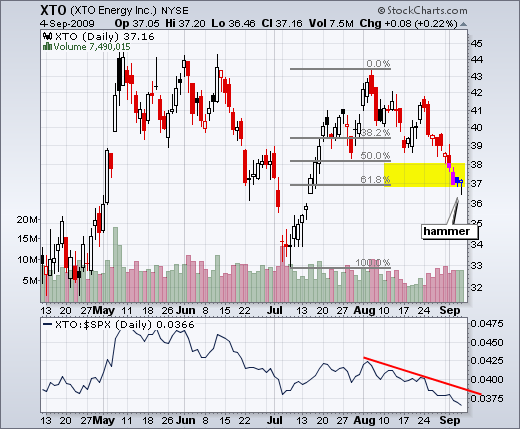
XTO forms a hammer at the 62% retracement, but the stock has shows relative weakness the last five weeks.
*****************************************************************
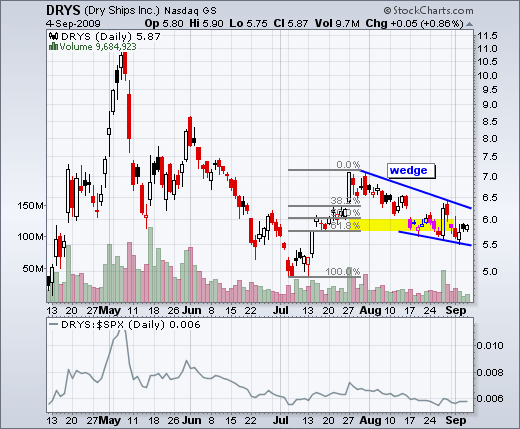
After a long white candlestick in late August, DRYS declined back to support and firmed the last three days.
*****************************************************************
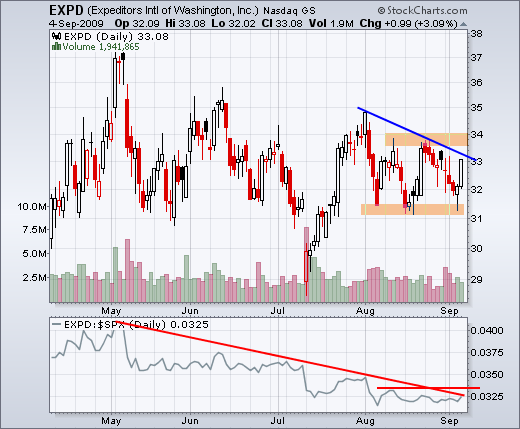
After a July surge, EXPD went into consolidation mode and then surged off support on Thursday-Friday.
*****************************************************************
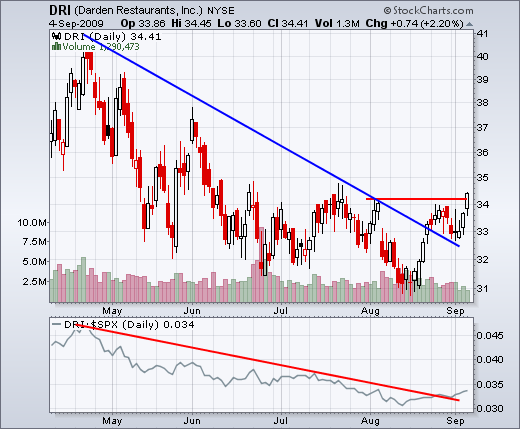
The bullish tailwinds of the stock market and the consumer discretionary trumped the August gap and support break in DRI. The stock recovered its August losses and then broke its August highs last week.
*****************************************************************
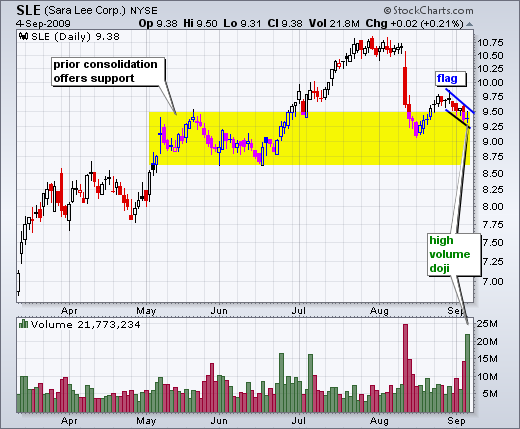
SLE forms high volume doji that could signal support. In addition, the stock has a small flag working and a break above Thursday's high would be bullish.
*****************************************************************

