-Back in the Saddle
-RSI Negative Divergence for SPY
-China Could Foreshadow Market Top
-Nasdaq Lagging NY Composite
-Interest Rates Continue to Fall
-Dollar Remains in Quiet Downtrend
-Gold Stalls Around 950
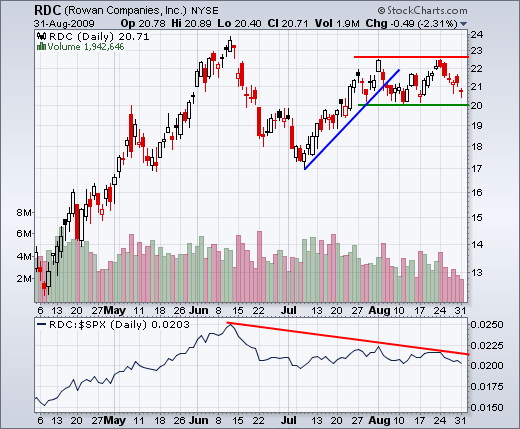
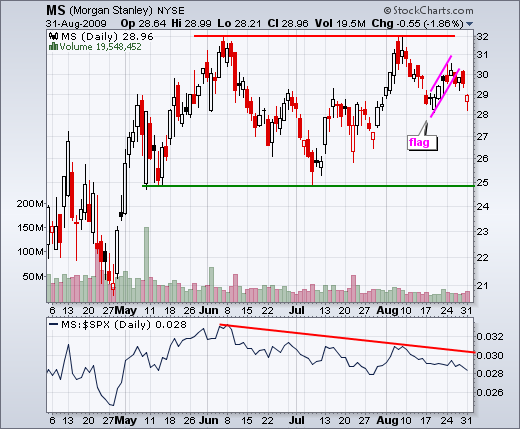
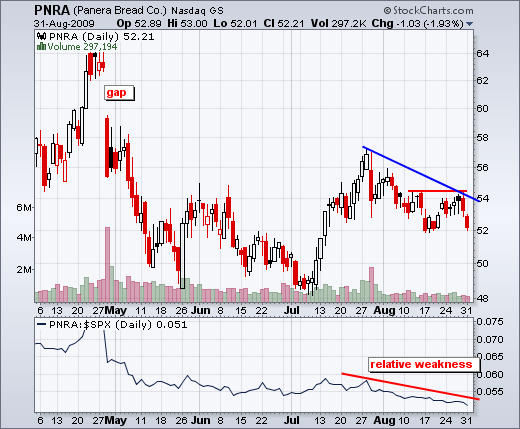
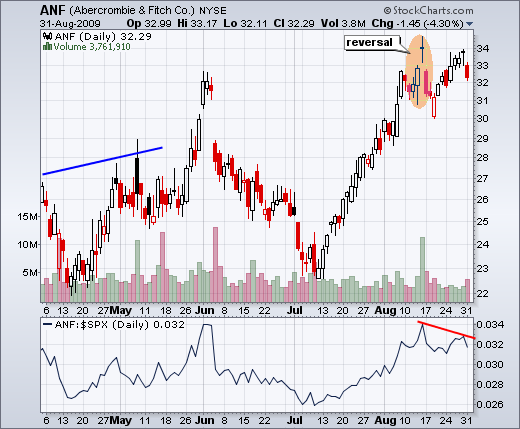
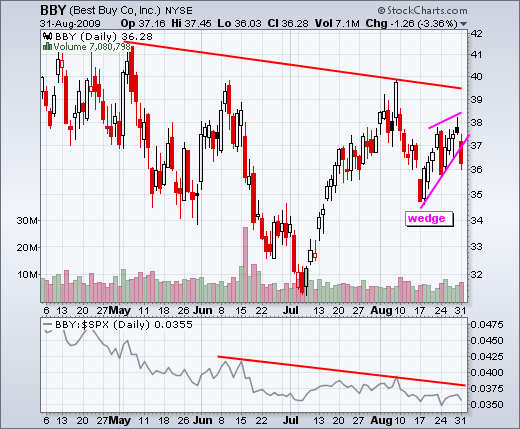
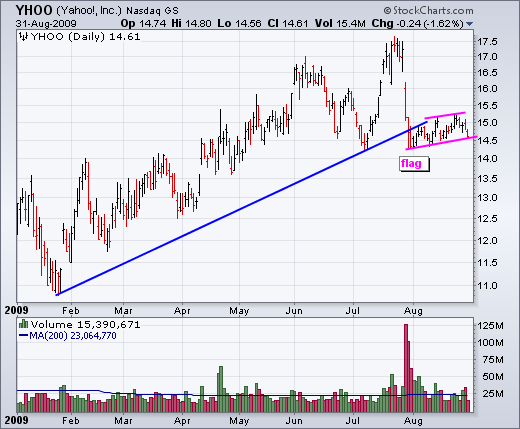
-Video Includes some Stock Setups
-Link to today's video
The next update will be September 4th (Friday) by 7AM ET.
*****************************************************************
See a chart you like or want to duplicate? Each chart image contains a link to the original SharpChart. Users can click on the chart to see the indicator settings and save the chart to their favorites list.
*****************************************************************
Back in the Saddle
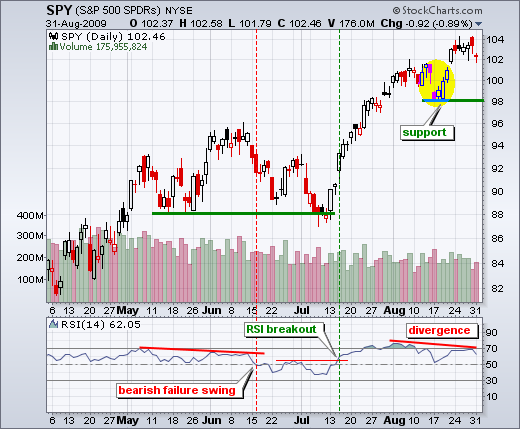
After a two-week vacation to the north of Spain (Costa Brava), I am back in the saddle studying the charts. Not much has changed in the last two weeks. Stocks were hit hard with a gap down on Monday, August 17th, but immediately firmed and filled the gap with a rally. Last week's trading was relatively flat as stocks digested the prior week's gains. The S&P 500 ETF (SPY) closed at 100.79 on Friday, August 14th, and at 102.46 on Monday, August 31st. With a new high in late August, the major stock indices remain in medium-term trends. Despite clear uptrend, I remain cautiously bullish because of overbought conditions and seasonal considerations.
*****************************************************************
RSI Divergence for SPY
While the S&P 500 ETF (SPY) moved to a new reaction high in late August, 14-day RSI failed to break above 70 and forged a lower high. This lower high amounts to a negative divergence in momentum. In other words, there is less upside momentum on the late August advance than on the prior advance. Not every negative divergence results in a trend reversal so I am waiting for RSI to break below its mid August low (50). According to Welles Wilder, developer of RSI, such a break would produce a bearish failure swing. There was a negative divergence and bearish failure swing in mid June that foreshadowed the last correction. As long as RSI holds above 50, momentum favors the bulls and the uptrend is not yet in jeopardy.
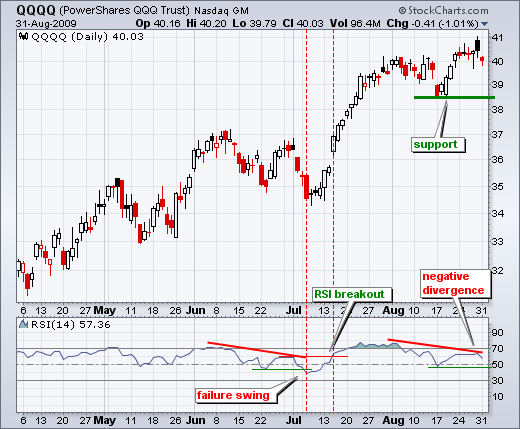
RSI for the Nasdaq 100 ETF (QQQQ) also sports a negative divergence that could evolve into a bearish failure swing. A break below the mid August low (RSI) would complete the bearish failure swing. Notice that RSI for SPY reached 70 in late August, but RSI for QQQQ fell well short of 70. Upside momentum for QQQQ is weaker than upside momentum for SPY. This is another form of relative weakness that could bode ill for the stock market.
*****************************************************************
China Leads Lower
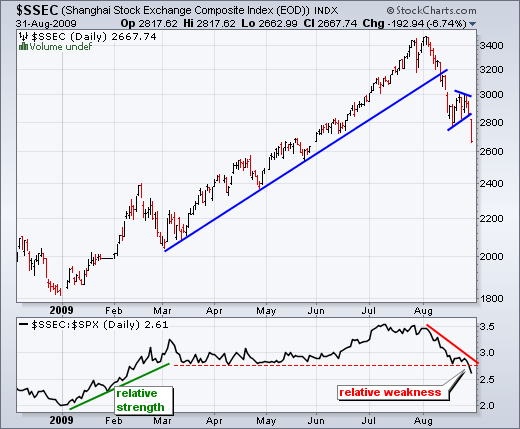
John Murphy wrote about the sharp decline in the Shanghai Composite ($SSEC). We should keep this in mind because weakness in Chinese stocks could extend to the US. Notice how the Shanghai Composite bottomed in late December, which was two months ahead of the early March bottom in the S&P 500. Relative strength in China foreshadowed the March-July rally in global equities. The Shanghai Composite could now be foreshadowing weakness in global equities as the index peaked in early August and broke pennant support with a sharp decline yesterday. The bottom indicator shows the price relative ($SSEC/$SPX ratio). China showed relative strength as the price relative moved higher in January-February. Now, China shows relative weakness as the price relative moved sharply lower in August.
*****************************************************************
Nasdaq Lagging NY Composite
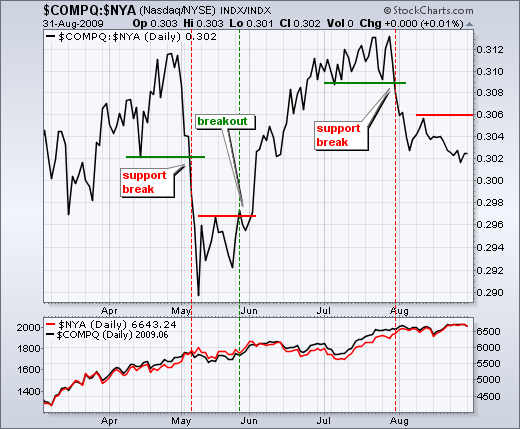
Relative weakness in the Nasdaq could reflect a diminished appetite for risk. By and large, the Nasdaq consists of stocks with higher betas and higher risk. The Nasdaq usually outperforms when the appetite for risk is strong and underperforms when the appetite for risk is weak. Risk appetite is important for an uptrend because it reflects confidence. Greater confidence gives way to more risk taking (stock buying). The chart below shows the Nasdaq/NY Composite ratio (a.k.a. the price relative). Notice that the price relative broke support at the end of July and remained weak throughout August. I consider this a negative sign for the overall market. The price relative would have to break above the mid August high (.306) for the Nasdaq to show relative strength.
*****************************************************************
Interest Rates Are Falling
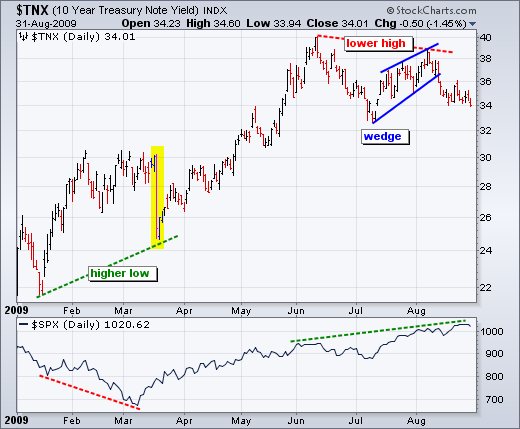
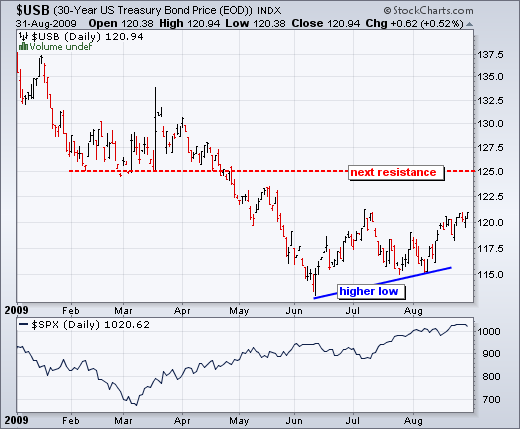
Conventional wisdom asserts that lower interest rates are bullish for stocks. However, as the chart below shows, that is not always the case. Notice how the 10-Year Treasury Yield ($TNX) bottomed in January, formed a higher low in mid March and surged into June. The 10-Year Treasury Yield surged from 2.5% to 4% (25 to 40) as the S&P 500 advanced over 300 points. Also notice that rates started rising ahead of the S&P 500, just as the Shanghai Composite did. Well, the opposite is happening right now. The 10-Year Treasury Yield forged a lower high and broke wedge support in August. It looks like rates are headed lower, which suggest that bonds are moving higher. Remember, rates and bonds move in opposite directions. On the second chart, the 30-year Treasury Bond ($USB) held above its June low in July-August and surged above 120. The next resistance area is around 125, which is over 6% higher.
*****************************************************************
Dollar Remains Quiet
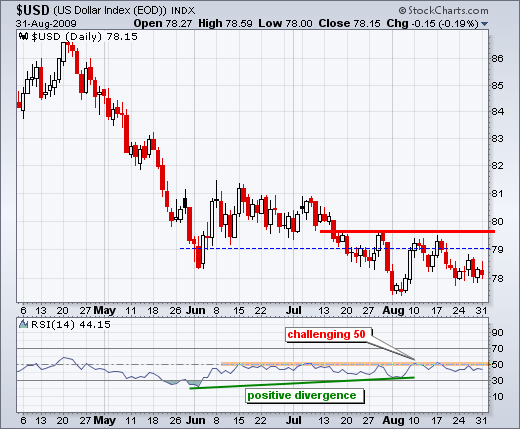
The decline in the US Dollar Index ($USD) has slowed, but has yet to actually reverse. After plunging below 79 in early June, the index managed to firm and trade on either side of 79 the last six weeks. Even though downside momentum is clearly slowing, we have yet to see an upside breakout to reverse the downtrend. The red line marks resistance from the late July high. A move above 80 would break resistance and reverse the downtrend. The bottom indicator shows RSI stalling just below 50. Look for a surge above 60 to trigger a momentum breakout. The downtrend remains in force until we see breakouts.
*****************************************************************
Gold Waits on the Greenback
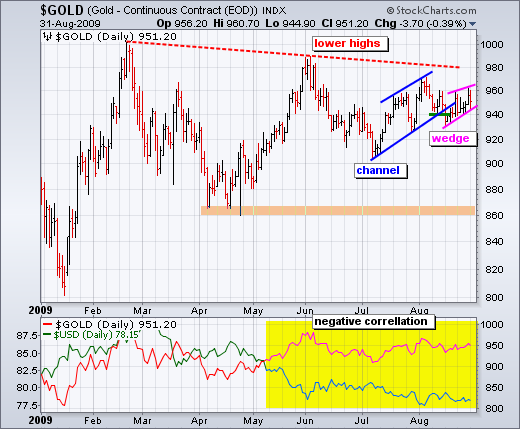
While the US Dollar Index oscillates around 79, the Gold-Continuous Futures ($GOLD) is trading on either side of 950. It looked like gold was breaking down with the channel break below 940 two weeks ago, but bullion bounced back immediately. A mini wedge is now taking shape with support at 940 - again. Look for a break below this level to trigger weakness in gold. I will also be cueing off the Dollar for clues.
*****************************************************************
Stock Setups

