-SPY Nears Long-term Retracement
-Current Advance Looks Like Wave 4
-Momentum Wanes on Daily SPY Chart
-Net New Highs Form Negative Divergence
-AD Lines and AD Volume Lines Remain Bullish
-McClellan Oscillator Turn Bearish
-Volatility Indices Break Resistance
-Link to today's video
-Next update: September 8th (Tuesday) around 7AM ET
-Click here for the stock setups video:
AMZN, ARO, BBY, AZO, BWA, CME, LUV, PG, RIMM, ROK, WFR
*****************************************************************
See a chart you like or want to duplicate? Each chart image contains a link to the original SharpChart. Users can click on the chart to see the indicator settings and save the chart to their favorites list.
*****************************************************************
Medium-term Evidence Still Bullish
When I look over the charts and key indicators, the bulk of the medium-term evidence remains bullish for stocks. Even though stocks took a pretty good hit over the last five days, it was not enough to fully reverse the medium-term uptrend. Yes, the stock market still looks vulnerable to a correction or even a medium-term trend reversal. However, a full fledge changing of the guard (bull to bear) has yet to materialize.
Before moving on, allow me to define the medium-term timeframe. Medium-term trends are based largely on the daily charts, which means movements can last anywhere from a few weeks to several months. Based on this timeframe, there are 2 to 6 trends per year. Frequency depends on volatility and strength of trend. Strong trends mean fewer, and better, moves. Volatility translates into shorter and trickier moves.
Today's commentary will first review the weekly and daily charts. Long-term retracement resistance is nigh, but the medium-term trend remains up. Next, I will run through some key indicators. Lots of warning signs popped up over the last two weeks, but many indicators have yet to turn bearish. For instance: a negative divergence formed in the Net New Highs indicators, but Net New Highs remain positive overall. The negative divergence is the warning. A move into negative territory would actually turn the indicator bearish.
*****************************************************************
Hitting the 50% Retracement
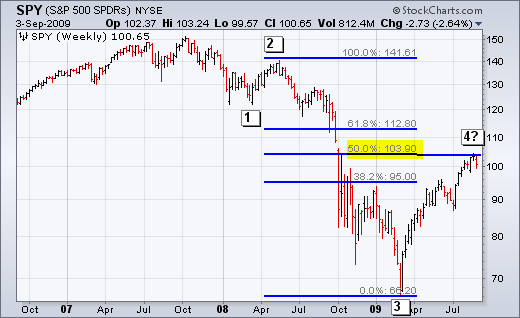
Before moving to the medium-term evidence, let's review the long-term charts. With the advance above 100, the S&P 500 ETF (SPY) retraced around 50% of the prior decline (May-08 to March-09). SPY advanced over 55% from the March low to the August high. There was one 4-week correction during this advance. With SPY overextended and near a key retracement, it looks vulnerable to a correction or a pullback. Further fueling the bearish fires, the Wave structure sure makes this advance look like the 4th wave of a 5-wave decline. Should a 5th wave down materialize, I would expect a move to at least the 75-80 range. However, the start of a fifth wave depends on a reversal of the medium-term uptrend.
*****************************************************************
Medium-term Uptrend In Place
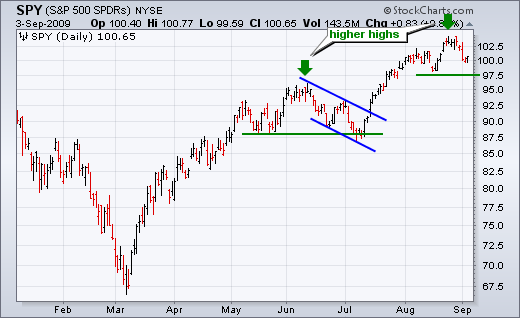
The next chart is about as simple as it gets. After the June-July pullback, SPY surged above its prior high to forge higher highs in August. This is the basic definition of an uptrend: higher highs and higher lows. At the very least, SPY would have to break below 97.5 to forge a lower low and even consider a reversal of this uptrend. Obviously, this would require follow through to this week's sharp decline with another push lower.
*****************************************************************
Upside Momentum is Waning
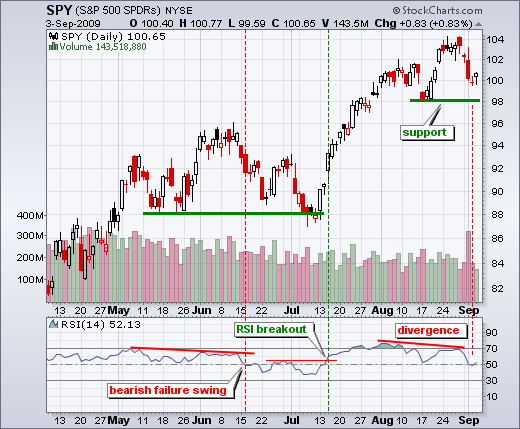
The weekly chart shows SPY overextended and near the 50% retracement after a potential wave 4 advance. The first daily chart shows a medium-term uptrend that remains in place. The second daily chart provides the first sign of weakness with waning upside momentum. RSI formed a negative divergence over the last few weeks and moved below its mid August low. A similar signal occurred in early June when SPY started its last correction. Although not shown on the chart, MACD also sports a negative divergence and moved below its signal line this week.
*****************************************************************
Net New Highs Remain Positive
Net New Highs for both the NYSE and the Nasdaq remain positive. The bulls have an edge as long as there are more new 52-week highs than new 52-week lows. Even though this indicator is currently bullish, there is a potential warning sign looming. While the NY Composite and Nasdaq moved to new reaction highs in August, there were fewer Net New Highs from July to August. This created a negative divergence between the indicator and the index. Not all negative divergences result in trend reversals. However, fewer Net New Highs shows narrowing participation in the last advance. It is another warning sign that would turn bearish should Net New Highs turn negative.
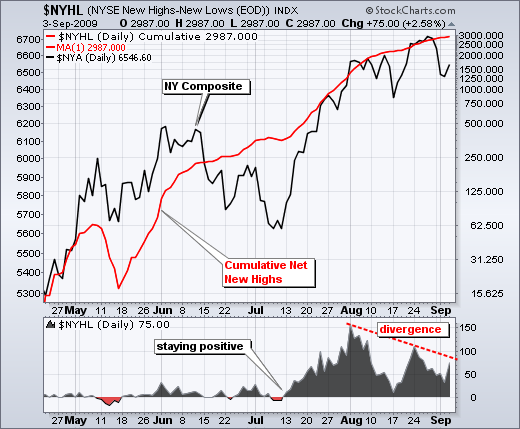
Click here for the Nasdaq Net New Highs chart.
*****************************************************************
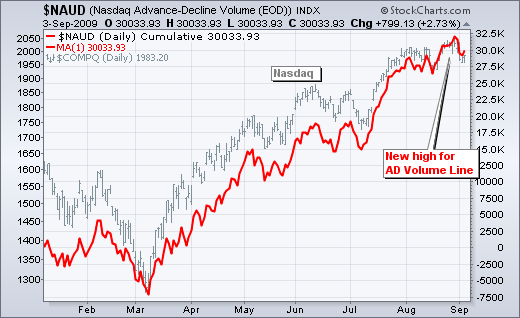
AD Line Hits New High In August
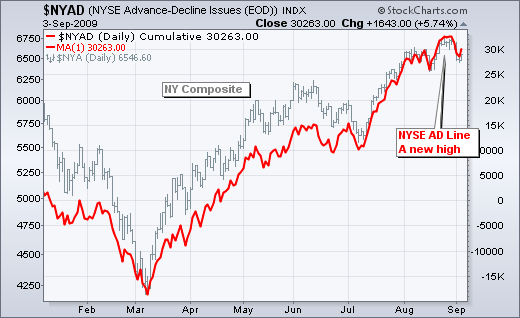
The AD Line and AD Volume Line for the Nasdaq and NYSE hit new highs in August. The first chart shows the NYSE AD Line in a clear uptrend. It may be overextended, but there is no sign of weakness, such as a negative divergence. The second chart shows the Nasdaq AD Volume Line with similar strength.
*****************************************************************
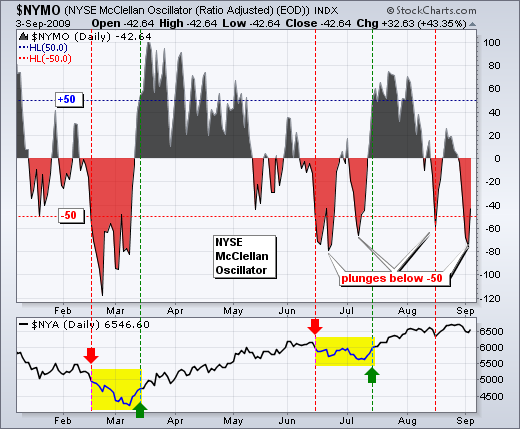
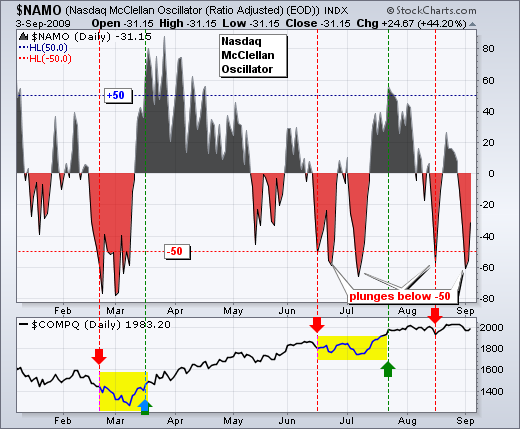
McClellan Oscillators Flash Warnings
Despite new highs in the AD Lines, the McClellan Oscillators flashed warnings with sharp declines below -50. The AD Line is a cumulative measure of Net Advances (advances less declines). Think of it like a price chart for an index or stock. The McClellan Oscillator turns Net Advances into a momentum oscillator, much like MACD. +50 is my bullish line in the sand. -50 is my bearish line in the sand. With both the Nasdaq and NYSE McClellan Oscillator plunging below -50 twice, these indicators are in bear mode. Like MACD and other momentum oscillators, the McClellan Oscillators provide earlier signals. While earlier signals are desirable, they are also more prone to whipsaw (being wrong).
*****************************************************************
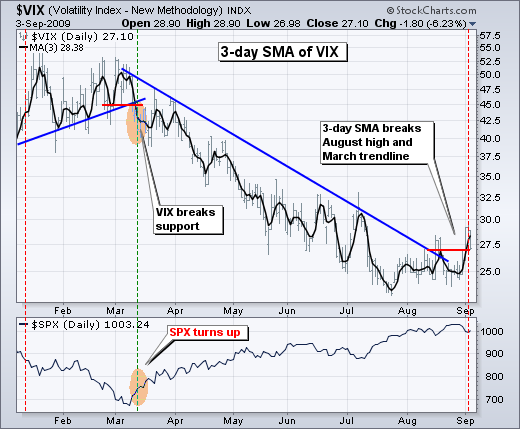
Fear Indices Surge
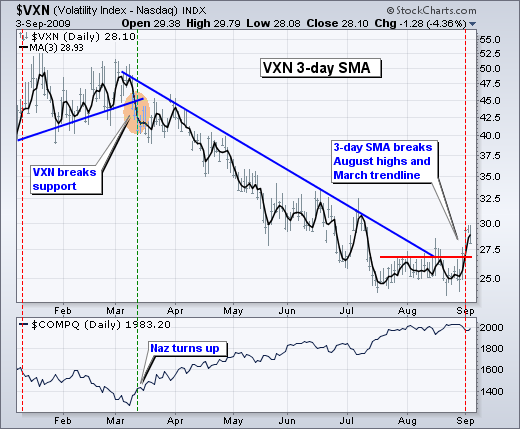
The S&P 500 Volatility Index ($VIX) and the Nasdaq 100 Volatility Index ($VXN) both broke above their August highs and March trendlines. I smooth out these indicators with a 3-day SMA. With this week's surge, the 3-day SMAs reversed their trends as well. Rising volatility is bearish for stocks. Notice that the March-August advance occurred when volatility trended lower.
*****************************************************************

