-SPY Bounces After Indecision
-SPY Hits Key retracement on Intraday Chart
-China and Japan Lag
-Net Advancing Volume Not that Strong
-Transport ETF Tests Broken Resistance
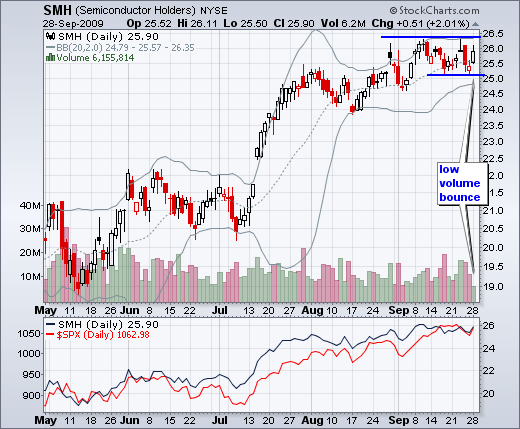
-Bollinger Bands Tighten for SMH
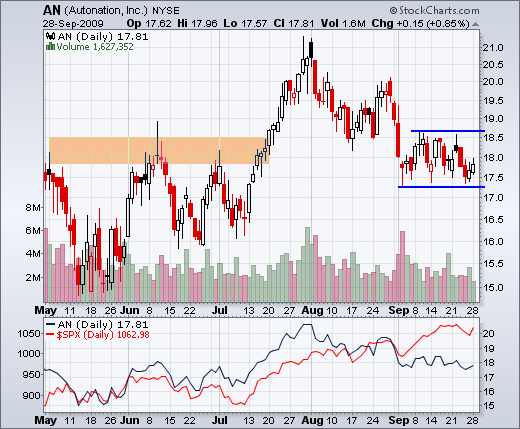
-Autonation (AN) Hits Support
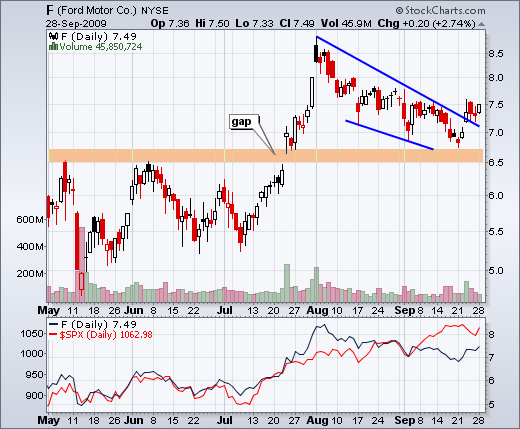
-Ford (F) Breaks Wedge Resistance
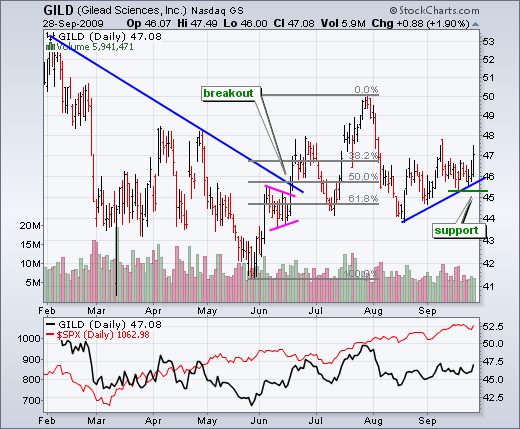
-Gilead (GILD) Maintains Uptrend
-Intuit (INTU) Bounces off Support
-Lowe's (LOW) Fails at Key Retracement
-Symantec (SYMC) Breaks Flag Resistance
-Click here for the video page
-Next update: Friday, October 2nd around 7AM ET.
*****************************************************************
To Top or Not to Top
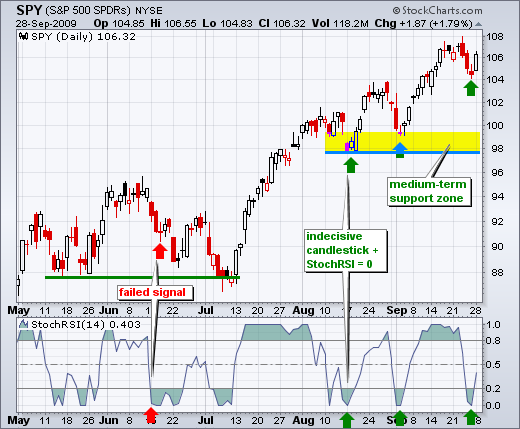
That is the question. Stocks were hit hard after the Fed meeting last Wednesday and followed through with further downside on Thursday. There was some firming on Friday and then a pop on Monday. Does Monday's pop signal a resumption of the medium-term uptrend? First, let's look at the daily SPY chart. Incidentally, these same analysis techniques can be applied to DIA, QQQQ and IWM. As I showed in the DIA chart on Friday, traders can use a combination of oversold StochRSI (zero) and an indecisive candlestick to identify short-term bottoms. The green arrows show the last three reaction lows identified by such setups. On Friday, StochRSI hit zero as SPY formed an indecisive candlestick. Monday's surge put in a short-term low within a medium-term uptrend. This signal looks good so far, but failures possible. See mid June for an example.
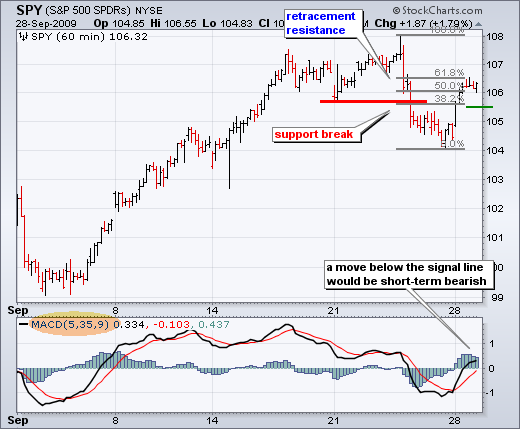
Even though the short-term trend is up, SPY finished near a key short-term retracement on Monday. The next chart shows 60-minute bars over the last four weeks. SPY broke support with a sharp decline last week and then retraced 62% of this decline with Monday's bounce. This Fibonacci retracement level can mark resistance and foreshadow a reversal. Therefore, it is time to be careful and watch closely. If Monday's surge signaled the start of another short-term advance, then I would expect most of the gains to hold. A move below 105.5 would call for a reassessment. In fact, such a move would reinforce retracement resistance and we could then see a continuation of last week's decline. Keep in mind that I am referring to the short-term situation (1-10 days).
*****************************************************************
Weakness in Net Advancing Volume
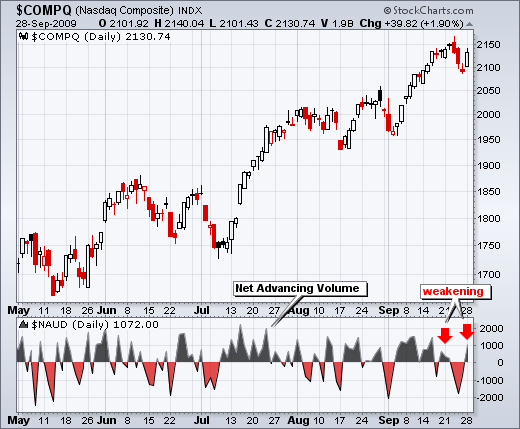
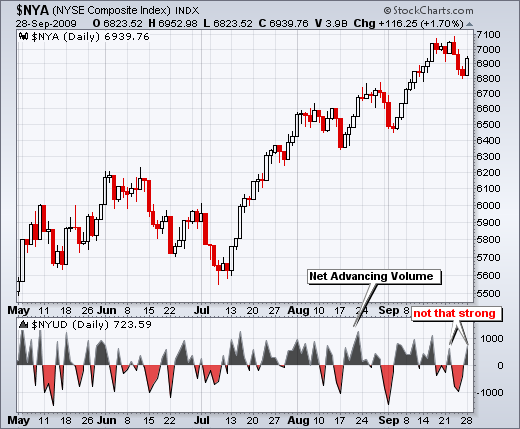
Despite a broad market bounce on Monday, I was not impressed with Net Advancing Volume for the Nasdaq or NYSE. Net Advancing Volume equals volume of advancing stocks less volume of declining stocks. The NY Composite and Nasdaq both moved higher last Tuesday and this Monday, but Net Advancing Volume was not that strong. While buying pressure still outpaced selling pressure, buyers may be loosing some of their mojo.
*****************************************************************
Asia Shows Relative Weakness
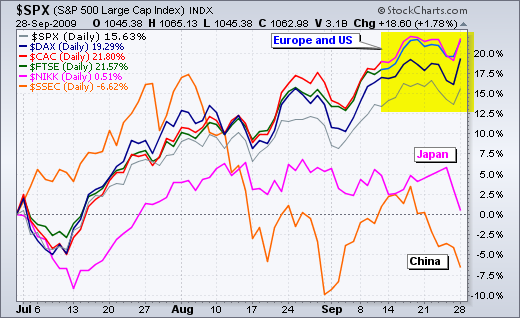
On a relative and absolute basis, the Nikkei 225 ($NIKK) and the Shanghai Composite ($SSEC) are much weaker than their European and US counter parts. The first chart shows three European indices, the S&P 500, the Shanghai Composite and the Nikkei 225. The Shanghai Composite is down over 5% since July, which is when the summer rally kicked off. The Nikkei is barely in positive territory. In contrast, the US and European indices have been moving consistently higher since July.
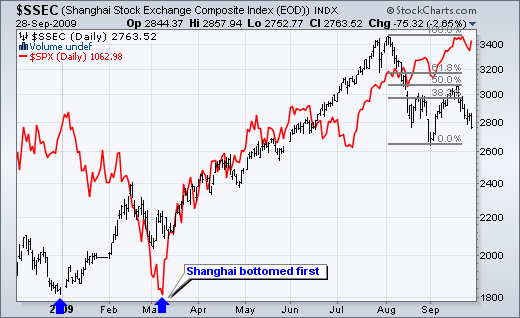
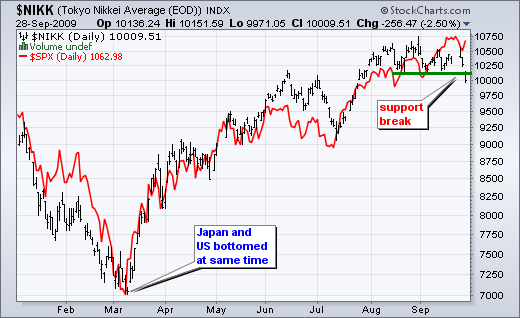
On the next chart, notice that the Shanghai Composite (black) bottomed about two months ahead of the S&P 500 (red). With the Shanghai Composite peaking in early August, the opposite could be happening now. Early August plus two months equals early October. On the price chart, the Shanghai Composite retraced 50% of its August decline and moved sharply lower the last two weeks. The next chart shows the Nikkei 225 breaking below its August-September lows.
*****************************************************************
Support Test for Transport ETF
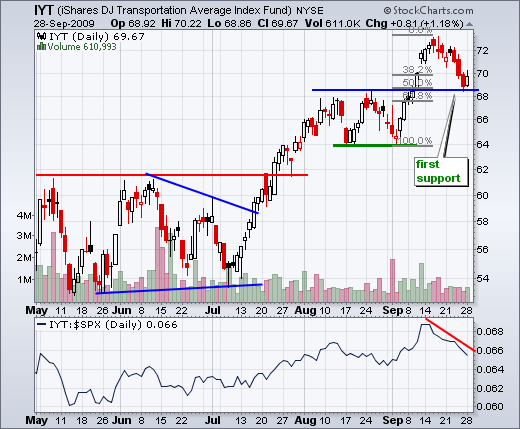
With the September surge, a number of stocks and ETFs broke resistance levels and became overbought. After last week's decline, many worked off these overbought conditions. The Transport ETF (IYT) broke resistance around 68 and returned to this breakout area, which turns into support. A strong breakout should hold. Notice that IYT formed a harami over the last two days (inside day). This indecision at support could give way to a bounce.
*****************************************************************
Low Volume Bounce for SMH
There is low volume and then there is LOW volume. The Semiconductors HOLDRS (SMH) bounced with the rest of the market on Monday, but volume was the lowest of the year. This does not inspire confidence. On the price chart, SMH has been consolidating the last few weeks with support around 25 and resistance around 26.5. Bollinger Bands are also narrowing. A break could be coming soon. Watch 26.5 up and 25 down.
*****************************************************************
Autonation hits support
Autonation (AN) did not fair well during cash-for-clunkers as the stock peaked in early August and declined into September. Even when the S&P 500 moved higher this month, AN remained subdued with a consolidation. Relative weakness is negative and a support break would open the door to the 15-16 area. With the stock finding support around 17, don't ignore the possibility of an upside breakout. A move above 18 would be the first clue to an impending breakout.
*****************************************************************
Ford Breaks Channel Resistance
Speaking of clunkers, Ford (F) found support near broken resistance and the July gap. After a falling wedge in August-September, the stock broke wedge resistance with a gap last week. This gap is bullish as long as it holds. A move back below 6.9 would call for a re-evaluation.
*****************************************************************
Gilead Edges Higher
Gilead Sciences (GILD) broke resistance in June and retraced just over 62% in July-August. Since the August low, the stock has been working its way higher with support just above 45. I consider this stock bullish after the June breakout and would expect higher prices as long as the mid September lows hold.
*****************************************************************
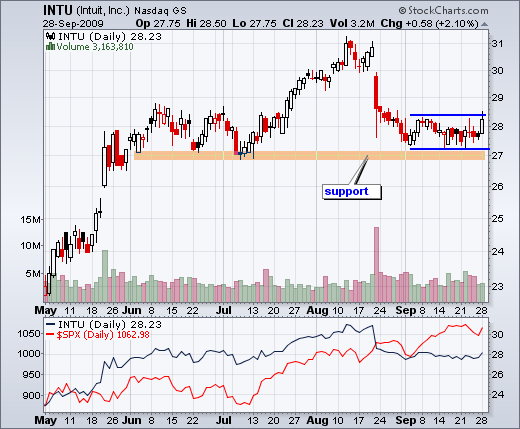
Inuit Bounces off Support
After getting hit hard in August, Intuit (INTU) managed to firm near its summer lows and consolidate around 28. The stock showed signs of life with firmness late last week and a bounce on Monday. A second move above 28.5 would be bullish. Conversely, a break below the September lows would signal a continuation of the August decline.
*****************************************************************
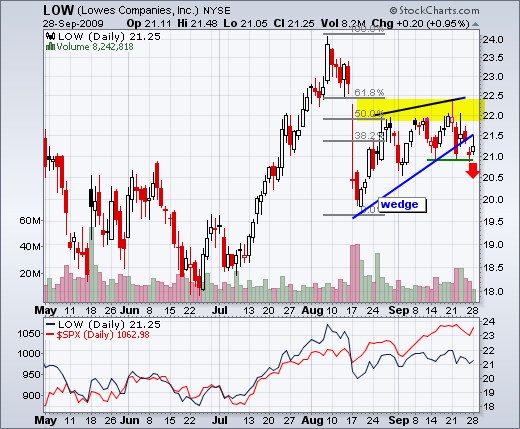
Lowe's Breaks Wedge Trendline
Lowe's (LOW) had a tough time last week as the stock declined below the wedge trendline with high volume. Overall, LOW met resistance near the 62% retracement and August gap. The wedge and retracement are typical for corrective advances. Last week's trendline break is negative and a move below the late September lows would argue for further weakness towards 18-18.5.
*****************************************************************
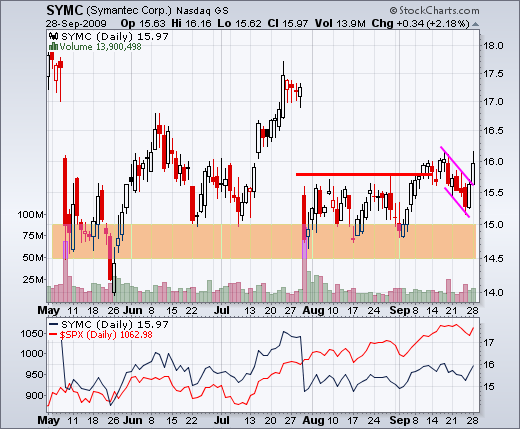
Symantec Breaks Flag Resistance
Despite two large down gaps in the last few months, Symantec (SYMC) managed to hold support in the 14-15 area. The stock firmed in August and then broke its August highs in mid September. After a pullback last week, SYMC broke flag resistance with a two day surge. This breakout is bullish until proven otherwise with a move back below 15.4. Strong breakouts should hold and a pullback this deep would warrant a reassessment.
*****************************************************************
Thanks for tuning in and have a great day!
*****************************************************************

