-Bulk of the Evidence Remains Bullish
-A Blip in the Uptrend
-Playing Short-term Pullbacks
-Big Picture Review
-Nasdaq McClellan Oscillator Lags
-Volatility Indices Testing Lows
-Dollar Gets Oversold Bounce
-Crude Breaks Support
-Gold Slips as Dollar Bounces
-Bonds Firm as Stocks Fall
-Breakouts Not Holding (ERTS and AZO)
-Click here for the Video Index Page
-Next update: Tuesday, September 29th around 7AM ET.
*****************************************************************
A Blip in the Uptrend
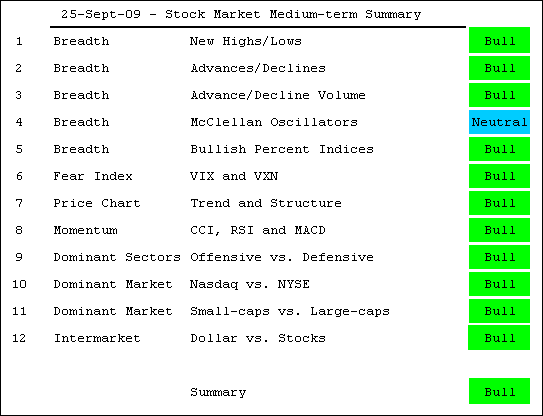
After stalling for four days, the major index ETFs forged reversal days on Wednesday and declined further on Thursday. This may be a short-term bearish development, but it is clearly not enough to reverse the medium-term uptrend. Therein lies the problem with playing the downside. The medium-term uptrend creates a powerful tailwind for the bulls. For a decline or pullback, this is a headwind that makes it difficult to profit on the downside. Sure, there will be pullbacks, but these are best suited for buying rather than selling. Remember, bull market rules apply when the bulk of the evidence is bullish. Here is an indicator run down in bullet format:
- Net New Highs remain in positive territory
- AD Lines hit new highs last week and remain in uptrends
- AD Volume Lines hit new highs last week and remain in uptrends
- McClellan Oscillator: bearish for Nasdaq; bullish for NYSE
- Bullish% Indices are all above 50%
- Volatility Indices are low and trending down
- Stock indices hit new highs and remain above support zones
- Despite negative divergences, momentum is bullish overall
- Offensive sectors continue to lead defensive sectors
- Nasdaq is starting to lead NY Composite
- Small-caps are leading large-caps
- Dollar downtrend is bullish for stocks
No one really knows when this current uptrend will end. Key retracement zones mark potential ending points on the weekly charts, but the trend remains in force until the bulk of the evidence turns bearish. Stocks were short-term overbought last week and early this week. With the key reversal day on Wednesday and decline on Thursday, stocks could be entering a corrective period that may involve a pullback or a trading range over the next few weeks.
*****************************************************************
Playing Short-term Pullbacks
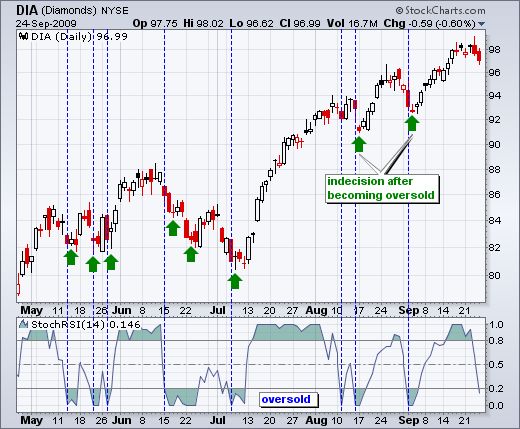
How do we know when a pullback is ending and an upside resumption is beginning? There aren't any hard facts on this one, but we can glean some insights from the recent past. The DIA chart is shown with StochRSI (14), which is the Stochastic Oscillator applied to RSI. The indicator is oversold when it dips below .20 (blue dotted lines). The first oversold indication was not always the best time to buy. Most of the time there was another test or dip after the initial oversold reading.
I think it is important to further qualify an oversold reading with some indecision or stabilization. The green arrows identify small indecisive candlesticks that can foreshadow a short-term low. Therefore, I would like to see two things fore considering a short-term low. First, StochRSI needs to reach zero. Second, DIA needs to form a small indecisive candlestick after a sharp decline. Indecision signals stabilization that could give way to a short-term bullish bounce.
*****************************************************************
Big Picture Review
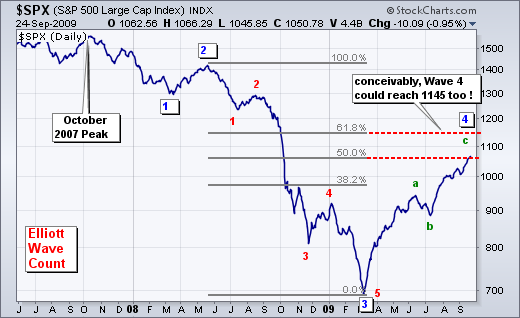
Last week I expounded on the difference between what I think (subjective) and what I know (objective). Using the S&P 500 as the market benchmark, I think the current advance is Wave 4 within a 5 wave decline. Wave 4 can be broken down into an ABC advance that should retrace 50-62% of Wave 3. In addition, Wave C can be equal to Wave A. Combined, this Elliott Wave assessment suggests that Wave 4 will end somewhere around 1100, plus or minus 50 points.
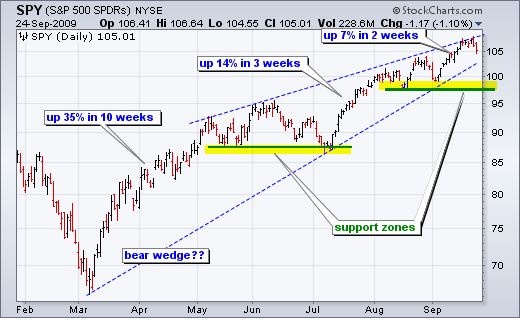
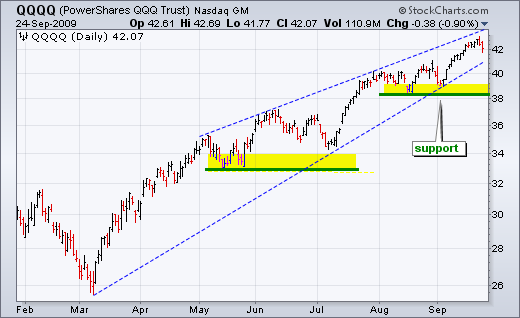
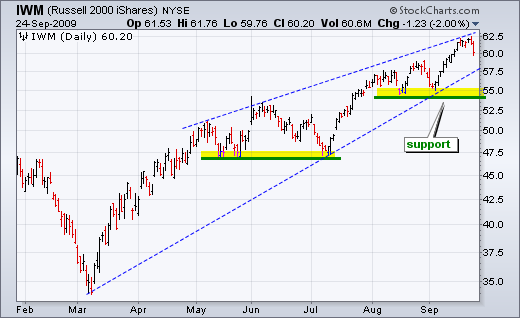
There are two problem with what I think. The current trend since March remains up and the bulk of the evidence is bullish. This assessment is more objective than Elliott Wave, which is pretty subjective. An uptrend is defined by higher highs and higher lows. Even though the current advance in SPY could be a bearish rising wedge, there IS a clear uptrend underway with higher highs and higher lows. The August-September lows mark a clear support zone. The bulls rule until the Russell 2000 ETF, Nasdaq 100 ETF and S&P 500 ETF break their August-September lows. All for one and one for all.
*****************************************************************
Nasdaq McClellan Oscillator Lags
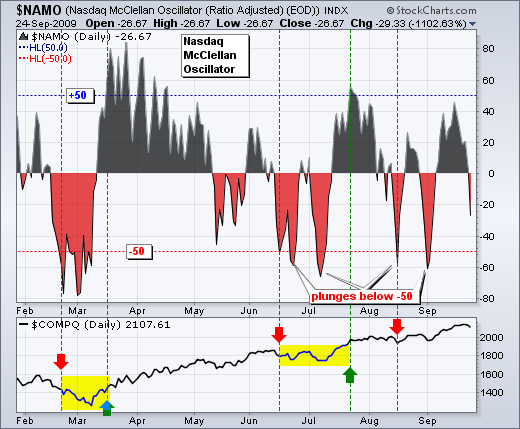
The Nasdaq McClellan Oscillator remains the one negative in the overall market picture. I am not too concerned about this because the AD Line and AD Volume Line hit new highs and remain bullish. In addition, Net New Highs remain comfortably positive. The Nasdaq McClellan Oscillator is considered bearish because it plunged below -50 in mid August and has yet to reverse this signal with a move above +50. There was a move above +40 in September, but the oscillator fell short of the +50 mark. In contrast, the NYSE McClellan Oscillator did surge above +50 in mid September to reverse its bearish signal.
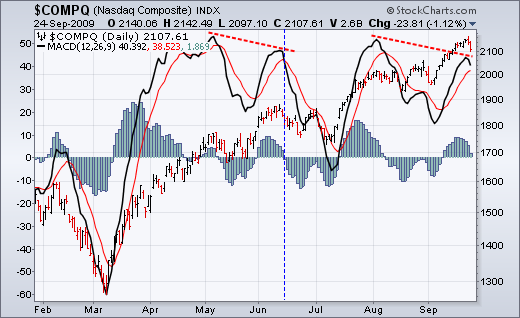
I like to think of the McClellan Oscillator as a momentum indicator for the AD Line. This means it is an indicator of an indicator, which means it is two steps removed from the underlying index (Nasdaq Composite). The McClellan Oscillator tells me that upside momentum in Net Advances is slowing, but the new high in the AD Line tells me that the uptrend in Net Advances remains in place. Slowing upside momentum is not the same as actual downside momentum. It is kind of like applying MACD to the Nasdaq. There is currently a negative divergence working from August to September, but the trend for the Nasdaq remains up after the new high in September. While most important peaks occur with a negative divergence in MACD, not all negative divergences mark important peaks.
*****************************************************************
Volatility Indices Testing Lows
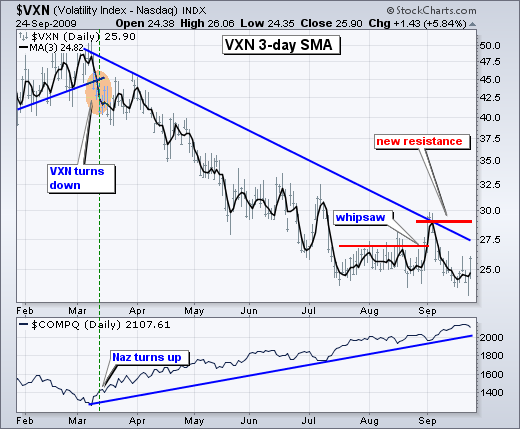
The volatility indices declined to new reaction lows as stock indices climbed to new reaction highs in September. I consider low and falling volatility bullish for stocks because it creates a climate of confidence. Rising volatility, on the other hand, creates a climate of fear that can exasperate selling pressure. In addition, there is clearly a negative correlation between the volatility indices and the stock indices. Volatility falls as stocks rise and visa versa. Some volatility gurus may consider this view too simplistic, but I think the writing is on the wall with this negative correlation. I also apply a 3-day SMA to the Nasdaq 100 Volatility Index ($VXN) and S&P 500 Volatility Index ($VIX) to smooth the fluctuations. The early September highs mark resistance for both. A move above these highs would trigger a breakout in volatility that would be medium-term bearish for stocks.
*****************************************************************
Dollar Gets Oversold Bounce
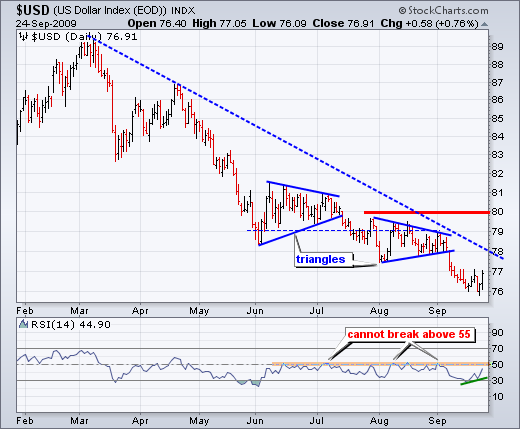
The US Dollar Index ($USD) is showing signs of life within its downtrend. After becoming oversold last week and hitting a new low this week, the index bounced with good gains over the last two days. This may be a good spot for bottom pickers, but the index remains well short of a trend reversal. I see a lot of resistance around 78-80 from the August consolidation.
*****************************************************************
West Texas Intermediate Breaks Support
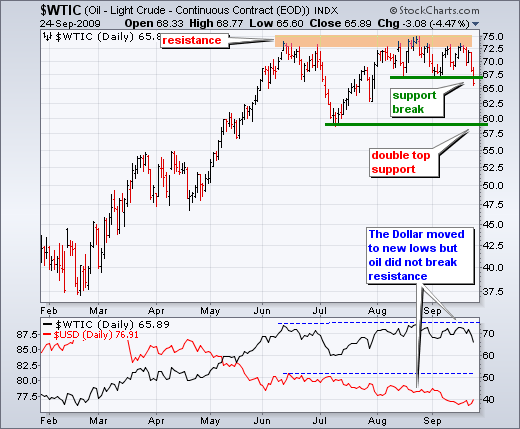
With the Dollar bouncing and oil supplies surging this week, West Texas Intermediate ($WTIC) fell sharply and broke support from the August-September lows. Oil could not break resistance when the Dollar was weak and the stock market was strong. The inability to advance in the face of positive news was negative. With this week's support break, we can now entertain the possibility of a double top forming with support around 58.
*****************************************************************

