-Evidence Remains Bullish For Stocks
-Wave 4 is Still Possible (me thinks)
-Current Uptrend is Still Actual (me knows)
-Net New Highs Expand Further
-Tech Sector0 Shows Relative Weakness
-AD Lines and AD Volume Lines Hit New Highs
-Volatility Indices Hit New Reaction Lows
-Stocks: XOM, APOL, AZO
-Video Link (click here)
-Next update: September 22 (Tuesday) around 7AM ET.
*****************************************************************
Stock Market Overview
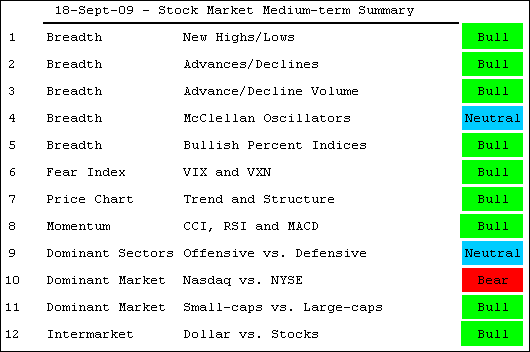
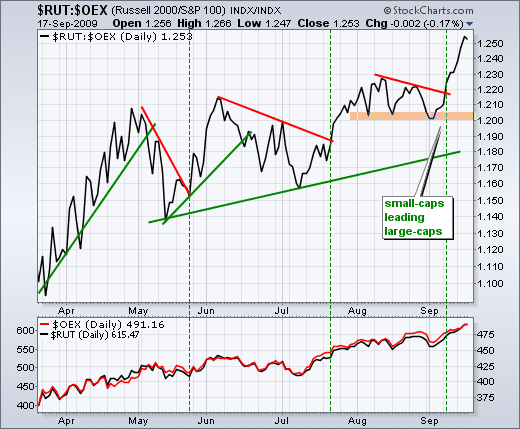
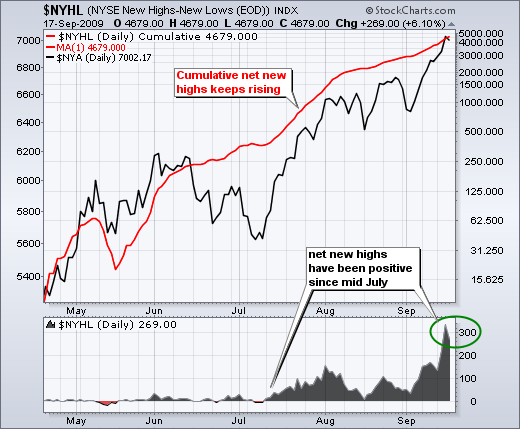
The bulk of the medium-term evidence remains bullish for stocks as the major index ETFs hit new reaction highs again this week. Both the Dow Industrials and Dow Transports broke above their August highs to affirm Dow Theory as bullish. Breadth remains bullish with the AD Lines and AD Volume Lines hitting new highs. NYSE Net New Highs surged above +300 this week. The McClellan Oscillators are split as the NYSE McClellan Oscillator pushed above +50, but the Nasdaq McClellan Oscillator failed to breach this key level. In addition, the Nasdaq continues to lag the NY Composite on the price chart and techs are showing relative weakness among the sector SPDRs. The Nasdaq and the technology sector have become recent soft spots in this bull run. Nevertheless, small-caps continue to lead large-caps and the bulk of the evidence still favors the bulls.
*****************************************************************
What is Actually There?
There are three possible outcomes when we sit down to analyze a chart. One: we see what we want to see. Two: we see what we think we see. Three: we see what is actually there. The market summary table above is designed to see what is actually there. We all have biases and I am trying to remove these biases by objectively looking at the bulk of the current evidence.
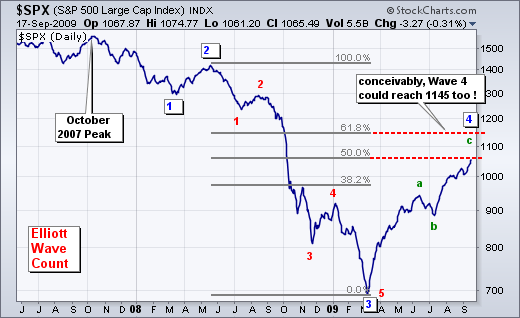
Looking at the current market situation, I THINK the current advance represents a cyclical bull market within a secular bear market. The first chart shows the long-term wave count for the S&P 500. I THINK the decline from May 2008 to March 2009 was Wave 3 of a 5 Wave decline. This means the Wave 4 advance could retrace 50-62% of Wave 3. Wave 4 also looks like an ABC pattern, which is typical for corrective moves. Wave A was 270 points and Wave C can sometimes be equal to Wave A, which means Wave C could extend to 1149. Also notice that a 62% retracement of Wave 3 would extend to around 1150. Therefore, I think the red dotted lines represent a potential reversal zone for the S&P 500.
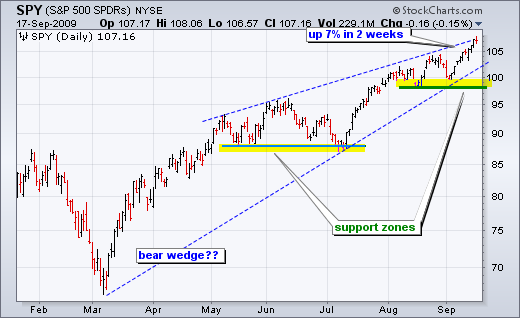
That is what I think. Now, what is actually there? The S&P 500 is currently trending up and the bulk of the evidence remains bullish. In other words, Wave 4 is still underway and shows no signs of peaking just yet. The S&P 500 overshot with the March low and could overshoot on this advance as well. As we have seen from the current advance, the length and duration of a move are largely indeterminable. Charles Dow figured this one out a long time ago. At this point, the expectation is for further gains until the bulk of the evidence turns bearish. Then, and only then, would we have an actual downtrend. On the daily bar chart, the S&P 500 is clearly in an uptrend. Even though a bearish rising wedge could be taking shape, the trend is definitely up. Even though the index is overbought after a 7% advance in two weeks, the trend is definitely up. As far as the medium-term trends are concerned, the support zones from the August-September lows hold the key. A downtrend will start when all the major indices and the major of sectors break below these support zones.
*****************************************************************
Technology Lagging the Broader Market
The S&P 500 can be divided into nine sectors, which are represented by the sector SPDRs. Perfcharts provide an easy means to view these sectors and their relative performance. The perfchart below shows sector performance relative to the S&P 500 for September (not absolute performance). Five sectors are outperforming and four are underperforming the S&P 500. In a surprising twist, the Technology SPDR (XLK) is one of the underperformers and this is a negative for the overall market. Is it enough to argue for a medium-term trend reversal in the S&P 500? No. However, it is something we should watch in the coming days and weeks. For now, the Consumer Discretionary SPDR (XLY), Industrials SPDR (XLI) and Financials SPDR (XLF) are showing relative strength. This is enough to keep the cyclical bull market on track. In addition, all nine sectors are in uptrends on the daily charts with the August-September lows marking key support. 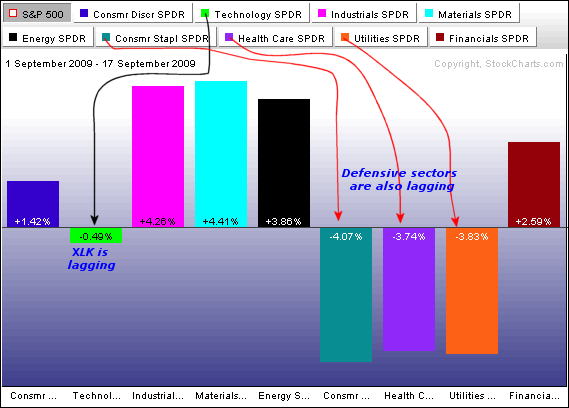
*****************************************************************
Nasdaq Lagging, but Small-caps Leading
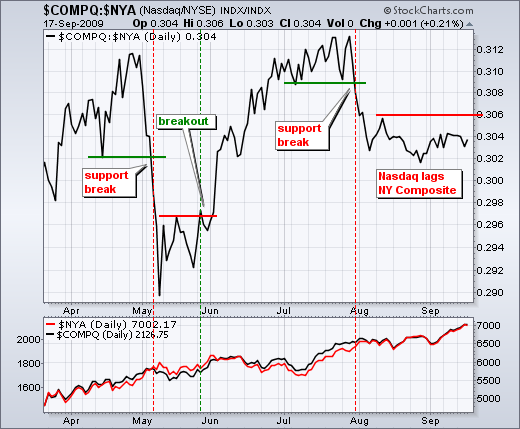
With the Technology SPDR (XLK) lagging the market, it is little surprise that the Nasdaq is also lagging the NYSE. The price relative (Nasdaq/NY Composite ratio) broke down at the end of July and remains down. A break above resistance is needed for the Nasdaq to start showing relative strength again.
In contrast to the Nasdaq, the Russell 2000 (small-caps) is leading the S&P 100 (large-caps). This is positive for the market. Recent relative strength in the Russell 2000 also reflects relative strength in small and mid-sized banks. After all, the finance services sector is the single biggest sector in the Russell 2000. Technology is second and consumer discretionary is third.
*****************************************************************
Net New Highs Remain Strong
Net New Highs show no signs of weakness as Net New Highs on the NYSE exceeded +300 for the first time since June 2007. Net New Highs on the Nasdaq exceeded +140 for the first time since October 2007.
*****************************************************************
News Highs for AD Line and AD Volume Line
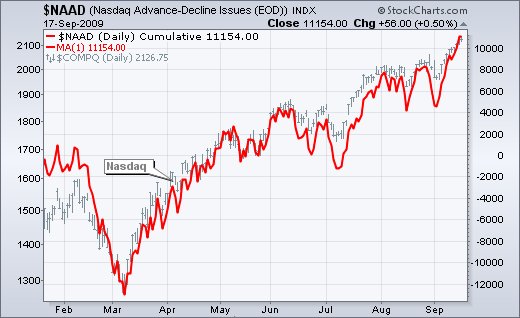
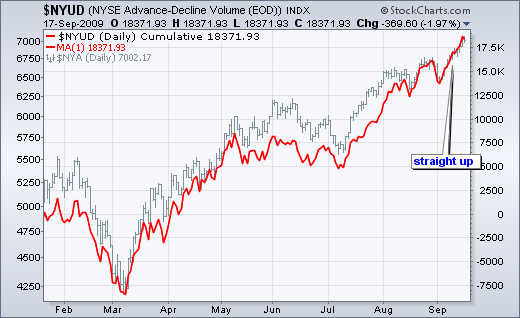
The AD Line and AD Volume Line for both the NYSE and Nasdaq recorded new highs this week. These indicators moved straight up over the last two weeks and easily exceeded their August highs. No downtrend or negative divergence here.
*****************************************************************
Fear Hits New Low
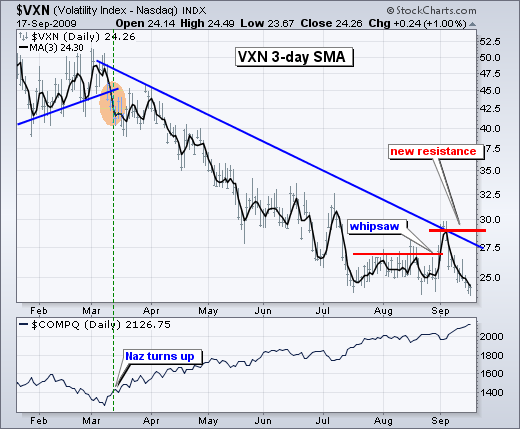
The S&P 500 Volatility Index ($VIX) and Nasdaq 100 Volatility Index ($VXN) are labeled as bullish again because they both recorded new reaction lows this week. $VXN broke above its August highs in early September and this prompted me to label these fear indicators bearish. After all, it looked like a breakout in fear. However, both volatilities indices moved sharply lower the last two weeks. Fear quickly subsided as buyers stepped into the market. It was a whipsaw, which is why I show a table of indicators. One or two indicators cannot dictate the state of the market. A consensus is needed. $VIX and $VXN must now exceed their early September highs to be considered bearish again.
*****************************************************************
XLE Surges without XOM
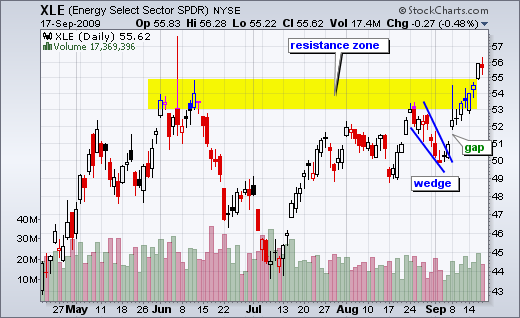
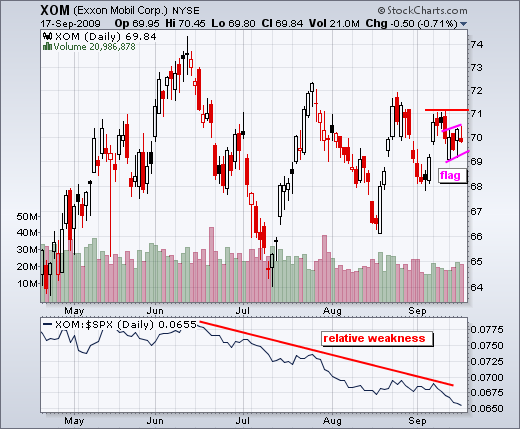
The Energy SPDR (XLE) surged above its June high this week, but ExxonMobil (XOM) remained subdued. The stock is lagging both the broader market and the energy sector. While relative weakness is a negative, the general uptrends in the market and XLE could pull trump. A break above last week's high would be bullish. Conversely, a break below 69 would be bearish.
*****************************************************************
APOL Surges on Good Volume
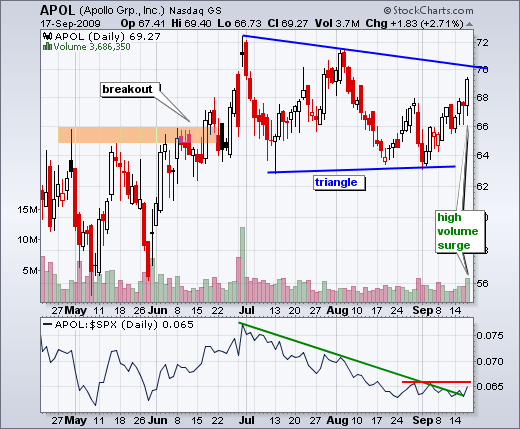
Apollo (APOL) has been lagging the market this summer, but may be ready to make up for lost time in September. After breaking resistance with a big move in June, the stock established support around 63-64 with three bounces in the last three months. Yesterday's advance on good volume shows new buying that could lead to a breakout.
*****************************************************************
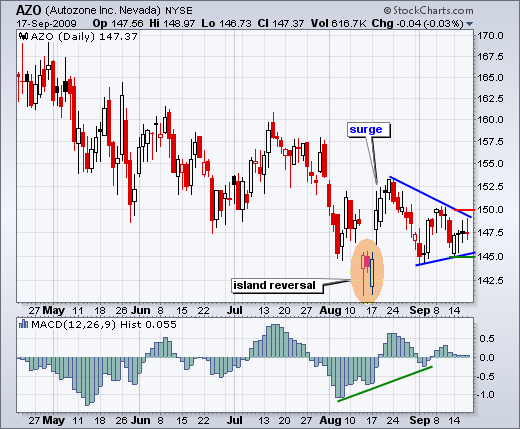
Autozone Stalls After Surge
Autozone surged with an island reversal and big move above 150 in mid August. Since then the stock pulled back and consolidated with a triangle. Trading is getting rather dull as the consolidation narrows. Watch for a break above 150 to trigger the bulls or a break below 145 to re-assert the downtrend.
*****************************************************************

