-Medium-term uptrend dominates decisions
-SPY is short-term overbought
-SPY forms bull flag on 60-minute chart
-Euro and stocks zigzag together
-Oil falls from resistance
-Bonds cue from commodities
-ATVI surges off support
-ERTS stalls at key retracement
-DYN breaks channel resistance
-HBAN battles breakout
-KEY pulls back after breakout
-Link to today's video (click here).
-Next update: Friday, September 25th around 7AM ET
*****************************************************************
Bull Market Rules
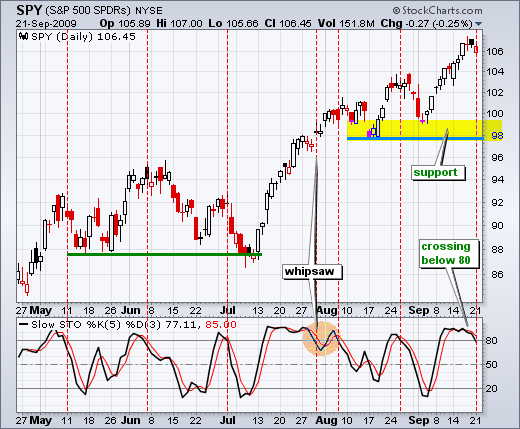
In the ChartWatchers newsletter this weekend, Carl Swenlin noted that bull market rules apply in current conditions. Swenlin suggests that we should "expect bullish resolutions rather than bearish ones". In other words, our bias should be bullish, not bearish at this point. This is valuable insight. Even though the market may be short-term overbought and ripe for a pullback, the medium-term uptrend carries more influence. As noted in Friday's commentary, the bulk of the evidence is currently bullish for the stock market. This means we should be looking for bullish setups on the price charts. Such setups include support tests, bullish candlestick patterns after short-term pullbacks and upside breakouts. Sure, there will be pullbacks from overbought levels, but these are harder to play when the bulk of the evidence remains bullish.
SPY provides a current case in point. With the run above 106 last week, SPY recorded a new high for the move that affirms the current uptrend. SPY is up over 6% in the last 12 days and many short-term momentum oscillators are overbought. The Stochastic Oscillator moved above 80 on September 10th and remained in overbought territory until yesterday. Monday's move below 80 is a sign that short-term upside momentum is slowing. The red dotted lines show prior crosses below 80. Except for the late July whipsaw, prior crosses below 80 foreshadowed sharp, but short, pullbacks. Because of the bigger uptrend, most of these pullbacks were hard to play.
*****************************************************************
Bull Flag on 60-minute charts
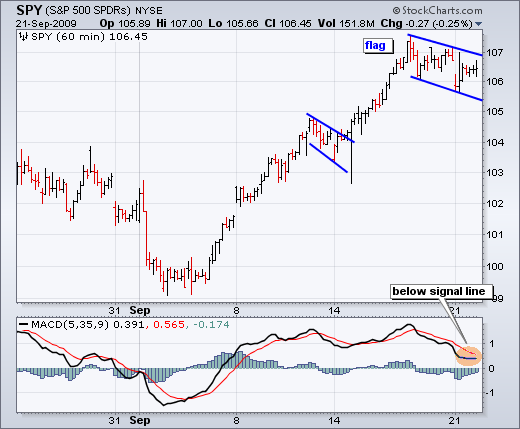
On the 60-minute chart, the pattern in SPY looks like a bull flag. This is the second bull flag in the last few weeks. Bull flags represent a slight correction after an advance. A move above the upper trendline (107) would break flag resistance and signal a continuation higher. The target would be around 109-110. Failure to hold the breakout and a move below 106 would negate this setup. MACD (5,35,9) is shown in the indicator window. A move above the signal line could be used to confirm a breakout.
*****************************************************************
FXE and SPY Positively Correlated
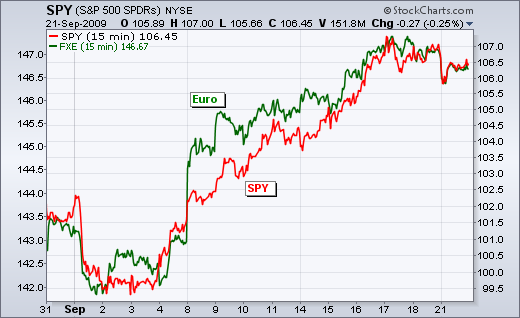
Much has been made about the negative correlation between the Dollar and stocks. By extension, this suggests a positive correlation between the Euro and stocks. As the chart below clearly shows, the Euro ETF (FXE) and the S&P 500 ETF (SPY) have been moving in lock step the last three weeks. It is simply amazing to see just how tightly correlated these two are. Even the zigzag pullback over the last three days matches up. The Euro zigs when SPY zigs and zags when SPY zags.
*****************************************************************
Oil Falls from Resistance
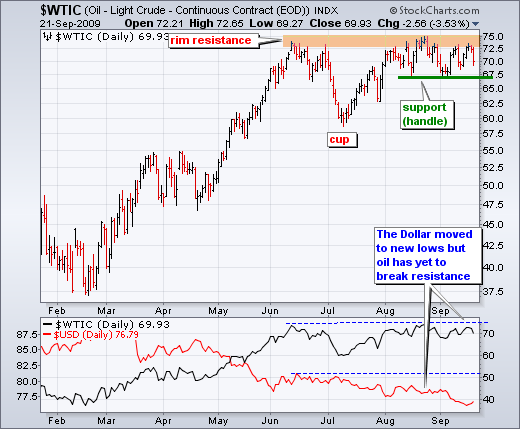
In the face of a weak Dollar and strong stock market, oil remains remarkably weak. This unexpected relationship is negative for oil. Basically, oil is not doing what it should be doing. Given the weak greenback and strong stock market, oil should be trading above resistance. There is one small problem. Oil is in a medium-term uptrend, which means bull market rules apply. By extension, an upside breakout of the cup-with-handle pattern is more likely than a break below support (Aug-Sep lows). Nevertheless, I think the handle consolidation of the last 7-8 weeks holds the key to the next directional move. An upside breakout is bullish, while a downside break is bearish.
*****************************************************************
Bonds Cue off Commodities
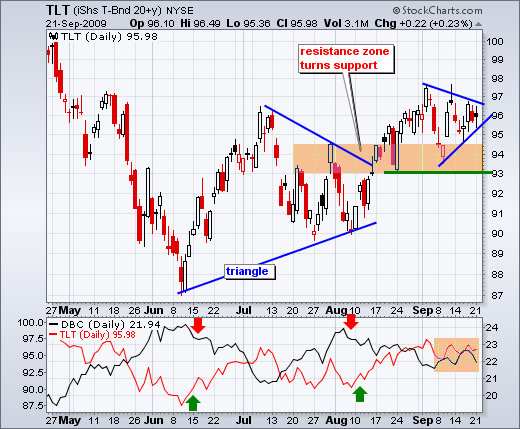
The direction of the break in oil will likely affect the bond market. An upside breakout in oil would be bullish for commodities and bearish for bonds. A downside break in oil would be bearish for commodities and bullish for bonds. In the bottom indicator window, I plotted the 20+ Year Treasury ETF (TLT) and the Commodity Tracking Fund (DBC). Notice how bonds rise (red) when commodities fall (black) and visa versa. On the price chart, TLT is holding the breakout around 93-94 and remains above key support. It is currently bullish. Another consolidation formed in September with resistance at 97. A break above this level would further the bullish argument for bonds.
*****************************************************************
ATVI Surges off Support
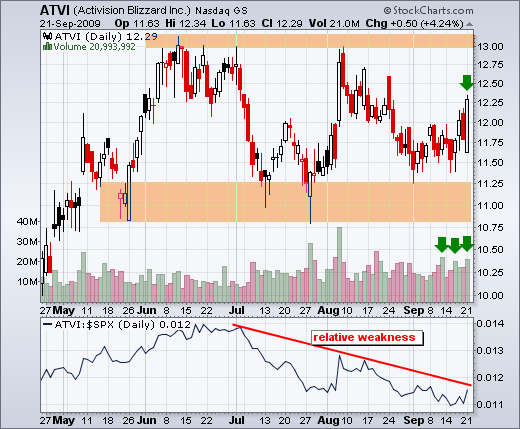
After falling to its support zone in August, Activision Blizzard (ATVI) firmed in September and upside volume started picking up the last two weeks. Notice how the stock was up twice with strong volume and then surged with strong volume on Monday. This looks like a successful bounce off support with the first upside target around 13 (next resistance). Activision Blizzard makes video game software.
*****************************************************************
DYN Breaks Channel Resistance
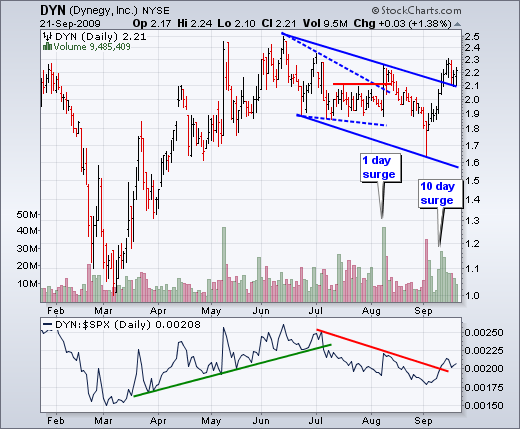
Dynegy (DYN) surged above channel resistance with good volume over the last few weeks. I featured DYN with the first breakout in early August (dotted lines), but it failed miserably. With a nine day advance on good volume, this breakout has more than one day behind it. That should improve the odds of it holding, but there are never any guarantees.
*****************************************************************
ERTS Hits Key Retracement
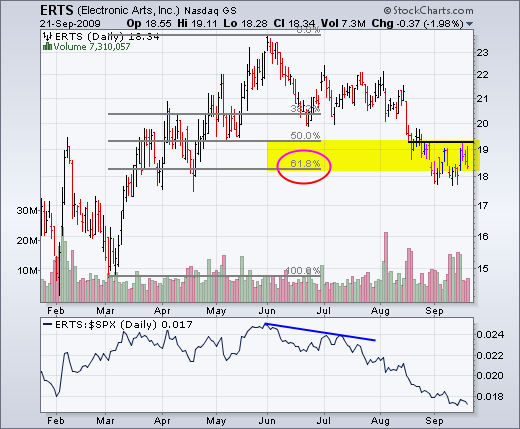
Electronic Arts (ERTS), another video game software company, did not get a big pop on Monday. Instead, the stock fell back from resistance around 19. Even though the trend since June is down and the stock shows relative weakness, ERTS is trying to firm near a key retracement level. A break above the September highs would warrant attention.
*****************************************************************
HBAN Battles Breakout
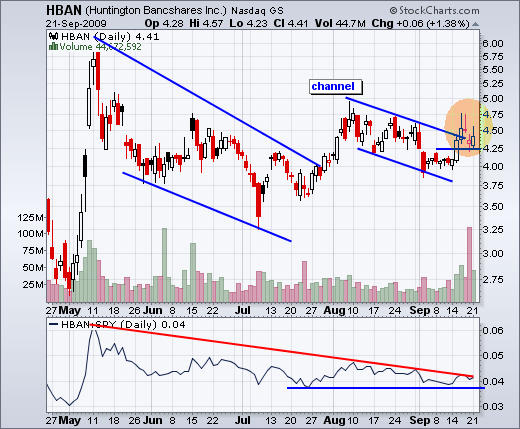
Huntington Bancshares (HBAN) broke channel resistance early last week, but fell back later in the week. The stock firmed with high volume the last two days and the breakout still holds promise. A move below the September lows would negate the breakout.
*****************************************************************
KEY Pulls Back After Surge
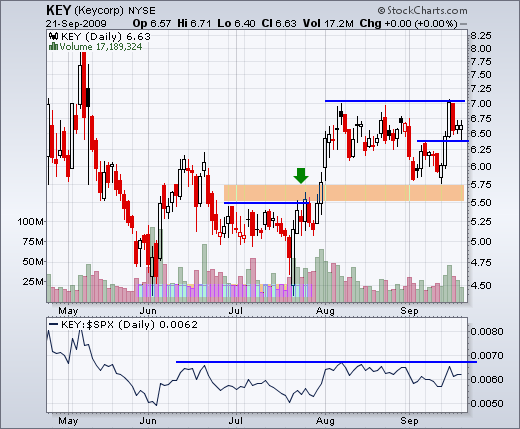
Keycorp (KEY), which is also a regional bank, surged above minor resistance last week and pulled back to the breakout. The stock firmed the last two days as broken resistance turned into support. With the bigger breakout in late July, I think the overall trend is up and this favors a successful support test around 6.30.
*****************************************************************
Thanks for tuning in and good luck.
*****************************************************************

