-Attempting a short-term low
-Setting short-term support for SPY
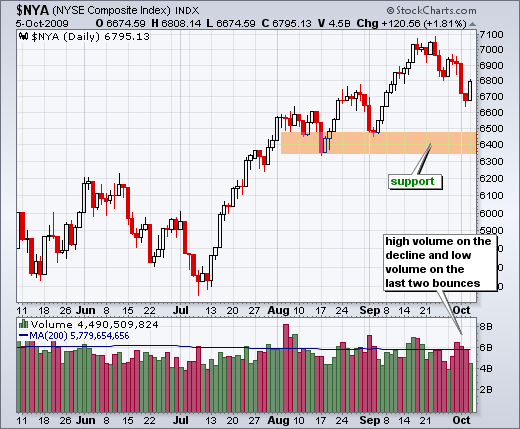
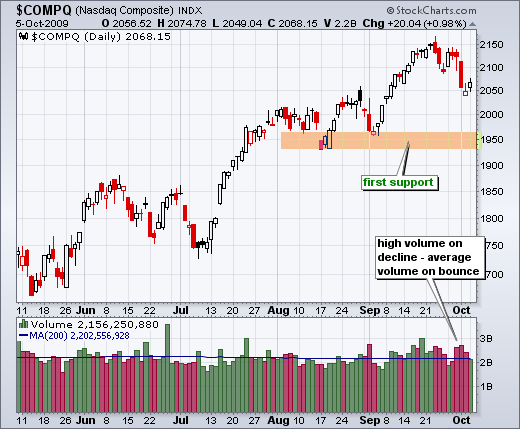
-Low Volume the last two Mondays
-Finance Sector Leads
-Regional Banks Lag
-Gold Miners ETF bounces off support
-AMAT forms hammer at support
-BG firms near key retracement
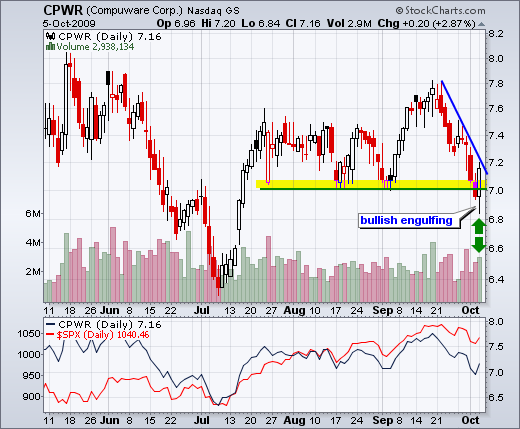
-CPWR forms bullish engulfing at support
-INTU maintains bullish bias
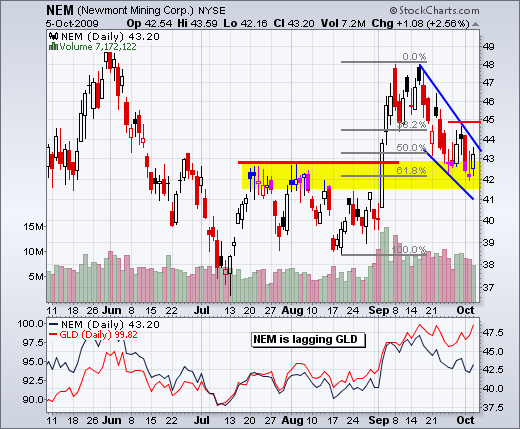
-NEM forms falling wedge
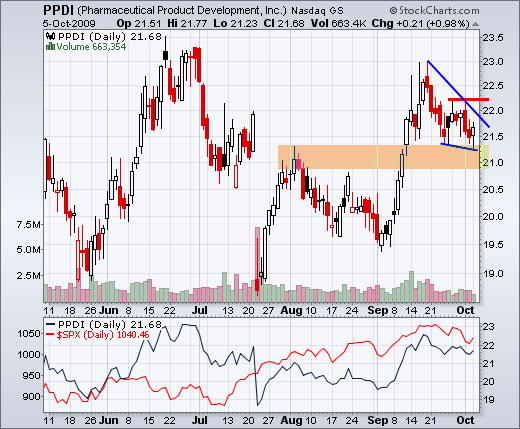
-PPDI pulls back to broken resistance
-Click here for video page
-Next update: Friday, October 9th around 7AM
*****************************************************************
Blog Additions
Over the next few days, I will be adding some annotated chart groups to this blog. Categories will include breadth, sectors, major indices and intermarket. The links can be found on the right side bar. Breadth charts were added yesterday and these will be updated every Friday. Each chart is linked to a live SharpChart. Click the chart to see current data and the settings.
*****************************************************************
Sharp Decline, Indecision and Bounce
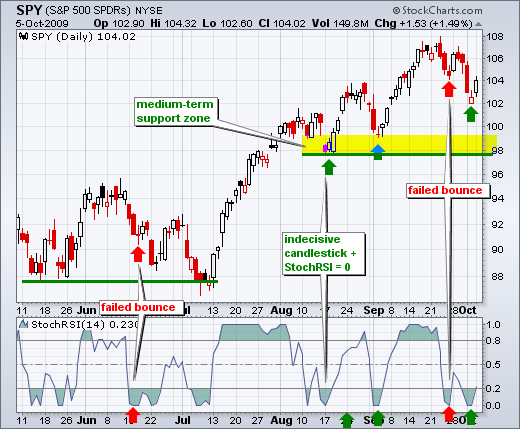
On Friday, September 25th, I featured the Dow Diamonds with StochRSI for anticipating short-term bottoms or bounces. In a nutshell, short-term lows often form when StochRSI reaches zero (oversold) and the ETF forms an indecisive candlestick (stalls). It is not a perfect system, but it is designed to forecast short-term lows within a medium-term uptrend. Bull market rules apply with medium-term up trends. In other words, we should be looking for bullish resolutions to pullbacks as long as the medium-term evidence favors the bulls.
On Tuesday, September 29th, I featured the S&P 500 ETF with the StochRSI setup. However, I was not impressed with volume and breadth on this bounce. Subsequently, this bounce failed to hold as the ETF plunged below 104 and StochRSI hit zero late last week. Despite this plunge, an indecisive candlestick formed on Friday and SPY bounced on Monday. Is this bounce for real or is it a dead-cat bounce like we saw last week? Breadth yesterday was okay, but volume was light and the Nasdaq showed relative weakness. Even though this bounce was not that impressive, the medium-term trend is up and the bulls still get the benefit of the doubt.
*****************************************************************
SPY Hits Short-term Resistance
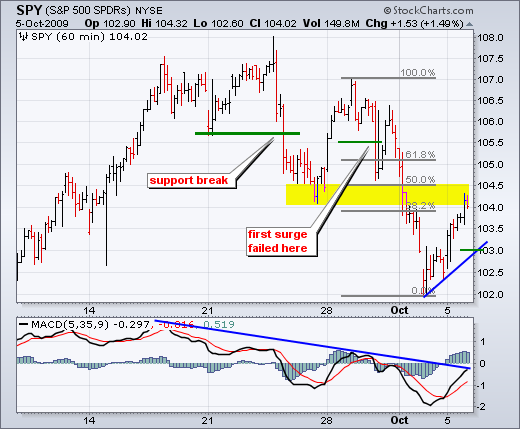
On the 60-minute chart, SPY is already trading near resistance from broken support. The yellow area shows a resistance zone around 104-104.5 from prior support. After a sharp decline from 107 to 102, SPY was short-term oversold and ripe for a bounce. The current bounce retraced 38-50% of this decline. Based on the retracement and broken support turning into resistance, SPY is already at a make-or-break point. At this point, the signal on the daily chart remains in play. However, weak breadth and low volume warrant a close watch. I am marking short-term support at 103. A strong bounce should hold. In other words, any type of a pullback should be minimal. Therefore, a break below 103 would be deemed short-term bearish and argue for further weakness towards 100.
*****************************************************************
Low Volume Bounce
As noted above, volume on yesterday's bounce was not impressive. The NY Composite was up 1.81% on volume that was well below average. The Nasdaq was up .98% on average volume. Notice that the Nasdaq lagged the NY Composite and the Nasdaq formed an indecisive candlestick.
*****************************************************************
Regional Banks Lag Finance Sector
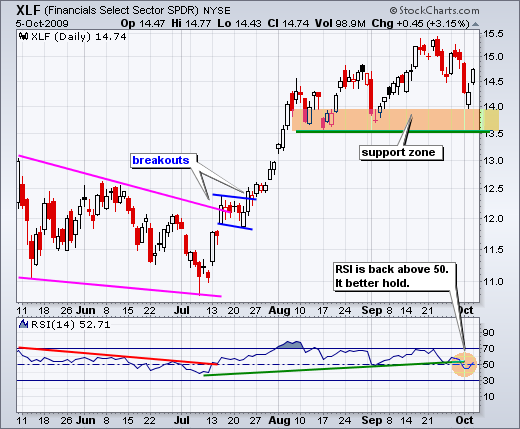
The Financials SPDR (XLF) led the market higher on Monday with a 3.15% gain. After a sharp decline last Thursday, XLF firmed with a white candlestick on Friday. XLF opened strong on Monday and finished strong to form another white candlestick. The medium-term trend remains up with a support zone around 13.5-14 for XLF. As far as Monday's bounce, a strong bounce should hold. A move below 14.20 would call for a reassessment.
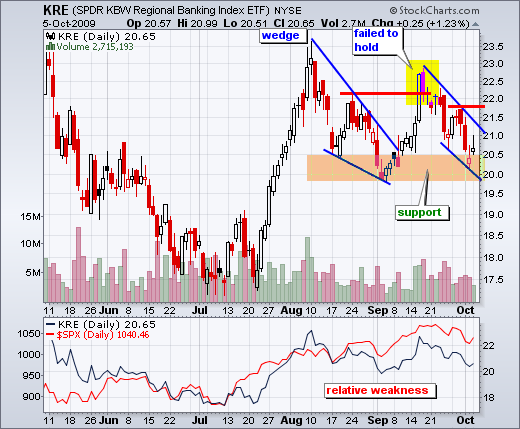
In contrast to XLF, the Regional Bank SPDR (KRE) was up just 1.23% on Monday. KRE also closed well off its intraday high. Overall, the ETF is moving lower within a falling price channel. There is support around 20-20.5, but relative weakness is a concern - as is low upside volume and high downside volume. At this point, some sort of upside catalyst is needed to affirm support. I would look for a close above the channel trendline with good volume. Otherwise, relative weakness in regional banks could work as a drag on the rest of the market.
*****************************************************************
GDX Bounces off Support Zone
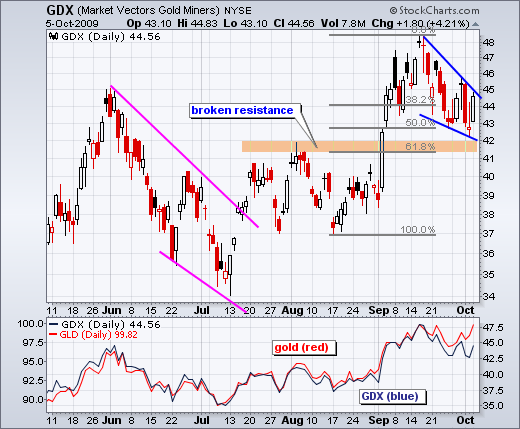
After a falling wedge pullback the last few weeks, the Gold Miners ETF (GDX) bounced off support with a 4.21% surge on Monday. Notice that the ETF found support near broken resistance and in the 50-62% retracement zone. Technically, GDX has yet to break the wedge trendline, but a little follow through in the next day or two would do the trick.
*****************************************************************
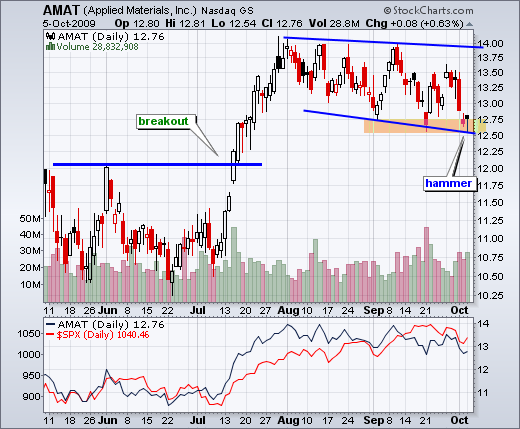
Applied Materials forms hammer at support. First, AMAT broke resistance with a big surge in July. This makes the bigger picture bullish. Second, the slow decline or consolidation over the last two months looks like a correction after that surge. Third, the stock established support with two bounces in September. Monday's hammer could be the next bounce off support. A little follow through above 13 would be short-term bullish. Support would then be set at 12.5.
*****************************************************************
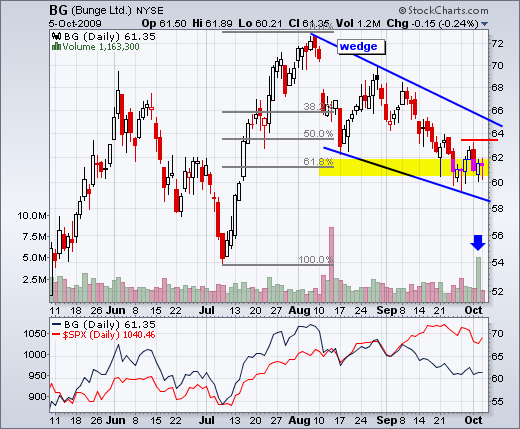
Bunge firms near key retracement. After a sharp advance in July, BG gave over 1/2 back with a retracement back to around 60. This retracement was around 62% and formed a falling wedge, both of which are typical for a correction in an uptrend. The stock bounced with high volume on Friday, but fell back on Monday. A little follow through above last week's high is needed to trigger a short-term breakout.
*****************************************************************
Compuware forms bullish engulfing at support. After a rather sharp decline the last few weeks, CPWR suddenly firmed at support with a large bullish engulfing on high volume. This is a good start and follow through above the blue trendline would reverse the short-term downswing.
*****************************************************************
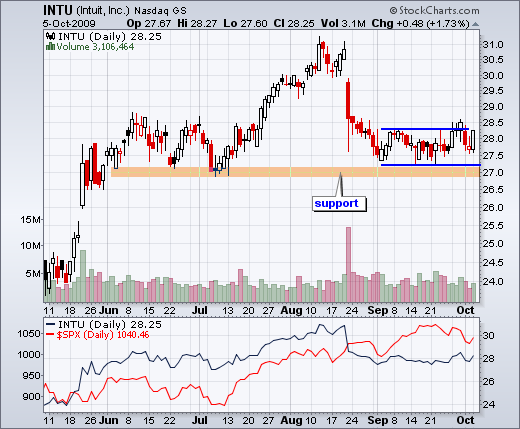
Intuit continues to hold support. After a sharp decline in August, INTU found support around 27.5 and firmed the last 5-6 weeks. There was a surge above consolidation resistance last week, but the stock fell back below 28. Monday's surge shows some resilience and I think the bulls are currently ahead in this battle. Failure to hold Monday's gains and a move below 27.5 would be bearish.
*****************************************************************
Newmont firms at support. As with the Gold Miners ETF, NEM is finding support near broken resistance and the 62% retracement area. The decline to support formed a falling wedge. Despite Monday's bounce, NEM remains within this wedge and has yet to break out. Look for follow through above 44 for the first signs of a breakout. Separately, but related, NEM has been lagging gold over the last few weeks.
*****************************************************************
Pharmaceutical Product Development firms at broken resistance. PPDI surged in early September and then corrected with a small wedge the last few weeks. The stock is finding support near 21.3 and a break above last week's high would be bullish.
*****************************************************************
Thanks for tuning in and make it a great day!
*****************************************************************

