-Medium-term evidence remains bullish for stocks
-SPY turns indecisive after sharp advance
-Using CCI for short-term signals in SPY
-Another bottom picking opp in the Dollar
-Oil advances to channel resistance
-Gold becomes overbought as GLD assets surge
-Bonds feel the heat of rising commodity prices
-Click here for the video page.
-Next commentary: Tuesday, October 13th
*****************************************************************
Blog Additions
On Monday, I will add some annotated chart groups to this blog. Categories will include breadth, sectors, major indices and intermarket. The links can be found on the right side bar. Breadth charts were added on Monday and these will be updated every Friday. Each chart is linked to a live SharpChart. Click the chart to see current data and the settings.
*****************************************************************
Medium-term Evidence Remains Bullish
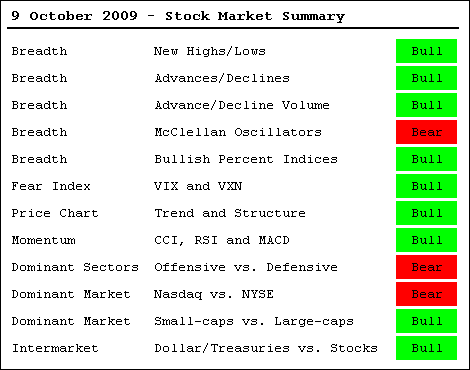
More red is appearing in the "evidence table", but the bulk of the medium-term evidence remains bullish overall. On the bullish side, the NYSE AD Line hit a new high this week and new 52-week highs continue to outpace new 52-week lows in both the Nasdaq and NYSE. With this week's bounce, another higher low formed and the overall trends for DIA, IWM, QQQQ and SPY remain up. The bullish percent indices are all above 50%. Momentum indicators are still above their centerlines (RSI>50 and MACD>0). The Dollar and short-term rates continue to trend lower. Small-caps continue to lead large-caps.
Three indicators on the table are bearish. First, the McClellan Oscillators plunged below -50 last week and have yet to recover. Second, the Nasdaq is showing relative weakness again. Third, the energy sector is the top performer over the last five weeks and the last five days. As the third biggest sector in the S&P 500, a good portion of this week's gains came from energy. This is not the sector we want to see leading the market.
Despite more negatives appearing, nine of the twelve indicators remain in bull mode. This table is not designed to pick tops. Instead, it is designed to adjust as the evidence evolves.
*****************************************************************
SPY Advances and Stalls
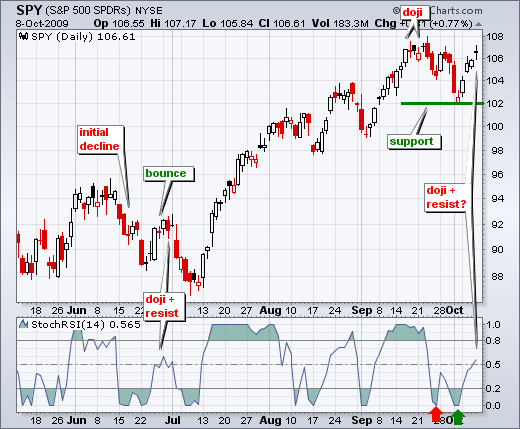
Even though the medium-term evidence remains bullish overall, stocks showed indecision on Thursday that could foreshadow a short-term peak. The stock market surged on Thursday, but there was no follow through and the major index ETFs formed indecisive candlesticks. DIA, IWM, QQQQ and SPY all formed doji on the day. These candlesticks look like plus signs (+) or crosses. Last week I talked about short-term bullish reversals occurring after a sharp decline and sudden indecision. Today, I am considering the opposite. Indecision after a short-term surge could foreshadow a short-term reversal. Even though stocks were broadly higher on Thursday, post-open price action was largely indecisive. Using SPY as an example, the ETF gapped up on the open and then formed a sizable doji on the day. There was virtually no change from open to close. SPY went nowhere after 6.5 hours of trading. Doji in mid September foreshadowed the late September pullback.
Once again I am looking back to June-July for clues. SPY declined sharply in mid June and then bounced back above 92. Notice that StochRSI bounced back above .50 in late June. Both SPY and StochRSI stalled for a few days and there was another push lower. Looking at the current situation, then there was an initial decline in late September and then the bounce this week. StochRSI moved above .50 yesterday. However, with SPY forming a doji, I would be on guard for a short-term reversal near current levels. Keep in mind that I am talking short-term here. As noted with the evidence table above, the bulk of the medium-term evidence remains bullish.
*****************************************************************
Short-term Bearish Trigger for SPY
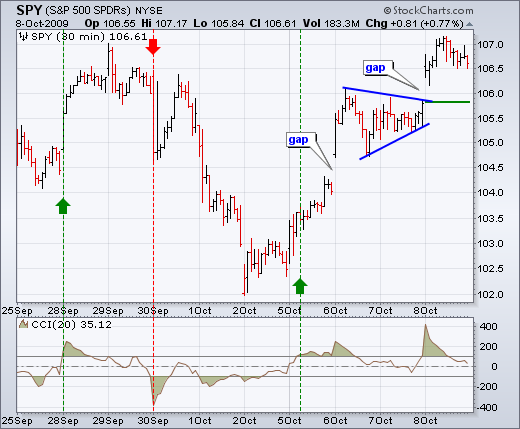
For short-term bearish triggers, we need to turn to the intraday charts. The next chart shows 30min bars for SPY with 20-period CCI. SPY gapped up twice this week and remains in a short-term uptrend as both gaps hold. My eyes are on yesterday's gap. A move below this gap would be short-term bearish. Failure to hold the gap would signal weakness that could lead to a short-term top.
The red and green lines show when CCI moved above +100 and below -100. These levels are normally associated with overbought and oversold levels. However, the ability to reach overbought levels shows strength, while the ability to reach oversold levels shows weakness. Therefore, I am basing short-term signals on signs of strength and weakness. A move below -100 in CCI would show short-term weakness and trigger a bearish signal. This signal would be in place until CCI moves back above +100.
*****************************************************************
Dollar Tests Support
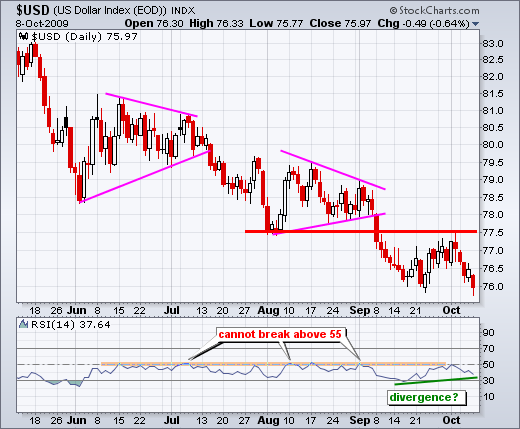
We all know about the negative correlation between stocks and the Dollar. In fact, it is so widely known, that it could be become a self-fulfilling prophecy. A Bloomberg article this morning quoted Bernanke saying that the Fed would have to raise rates "at some point" to keep inflation under control. This is the most hawkish thing Bernanke has said in over a year. As a result, the Dollar is up this morning and we are once again entertaining the idea of picking a bottom in the Dollar. The chart below shows the US Dollar Index ($USD) testing its September low and RSI holding above its September low. A bullish divergence is in the works for RSI. A break above the 50-55 zone would turn RSI bullish. A break above 77.5 would reverse the downtrend in the Dollar.
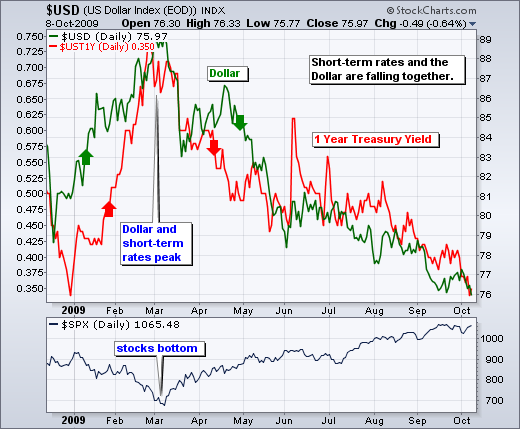
As noted in Wednesday's Market Message, there is a positive correlation between short-term rates and the Dollar. Both have been in a relentless downtrend since March. A shift in Fed policy could reverse the downtrend in short-term rates and lift the Dollar. This combination would be negative for the stock market.
*****************************************************************
Oil Tests Channel Resistance
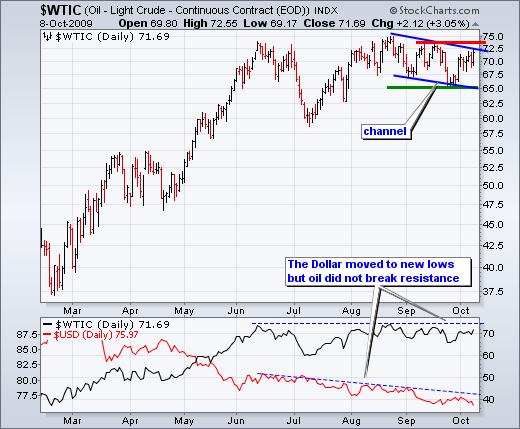
A decline in the stock market and rise in the Dollar would be bearish for oil. Remember, I am still at the speculation phase. We have yet to see an actual break down in the stock market or a trend reversal in the US Dollar Index. West Texas Intermediate ($WTIC) surged back above $70 this week and is challenging channel resistance. As this channel shows, oil has been working its way lower since late August. A break above the September highs (channel resistance) would signal a continuation of the current uptrend.
*****************************************************************
Gold Gets Overbought
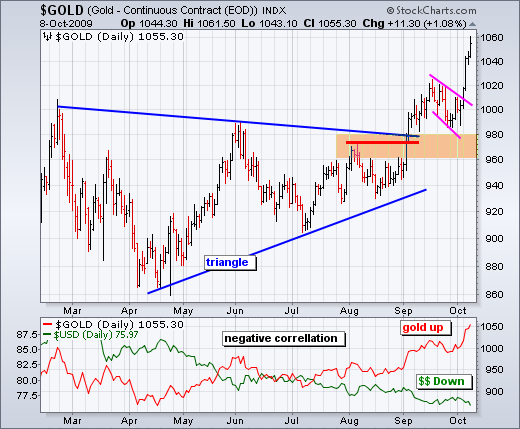
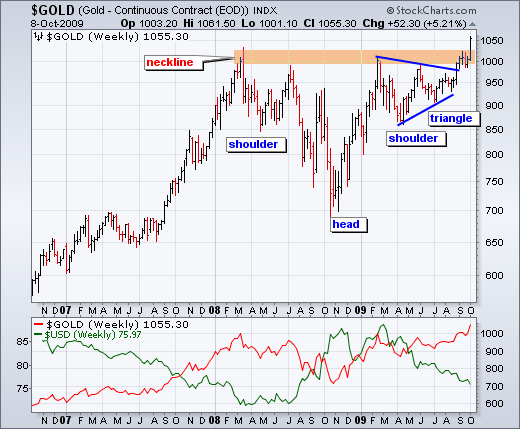
Is there anyone who isn't bullish on gold and bearish on the Dollar? Back-of-the-envelope sentiment readings are tricky, but it seems that bullish sentiment for gold is through the roof. Assets in the Gold ETF (GLD) are now at $37 billion, which is more than double the $18 billion in assets reported last November. GLD is now the second biggest ETF in assets. SPY is first with almost 70 billion. Regardless of overtly bullish sentiment, the price chart for gold remains bullish overall. The Gold-Continuous Futures ($GOLD) broke triangle resistance in early September, consolidated and surged above 1050 this week. Gold is up over 5% this week alone. This makes it short-term overbought and ripe for a correction or consolidation. On the weekly chart, the broken resistance zone around 1000 turns into a big support zone to watch on any pullback.
*****************************************************************
Bonds
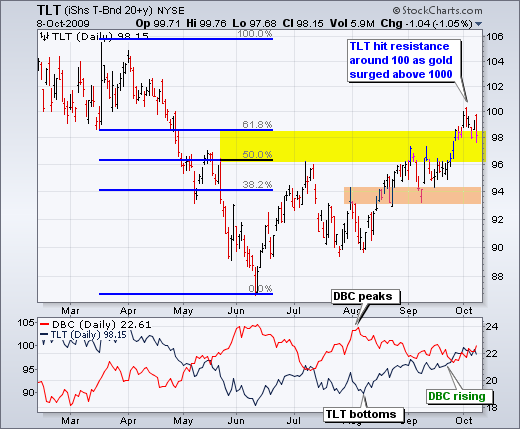
I am becoming concerned with the rally in bonds. The overall trend for the 20+ Year Treasury ETF (TLT) remains up, but selling pressure increased over the last five days. In addition, the Commodity Tracking Fund (red line) has been moving higher the last two weeks. Bonds are negatively correlated to commodity prices (inflation). Something needs to give here. Either commodity prices peak and turn lower, or bonds are likely to come under further selling pressure.
On the price chart, TLT met resistance around 100 over the last five days. There is also potential resistance in this area from the 62% retracement mark. This is a spot for top pickers, but I am not ready to turn bearish on bonds just yet. Instead, I will wait for some sort of downside catalyst to affirm a top and reversal.
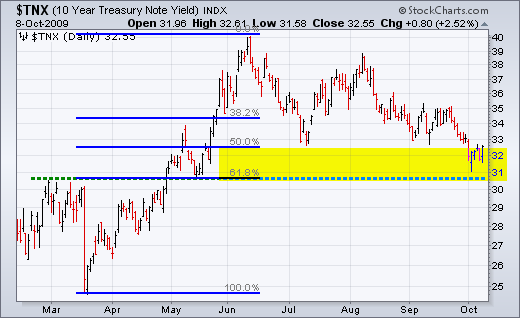
The second chart shows the 10-Year Treasury Yield ($TNX), which moves inverse to bonds. After a big surge from March to June, bond yields worked their way lower the last four months. TNX is currently trading near the 62% retracement mark and trying to firm around 31-32 (3.1%-3.2%). Also notice that broken resistance turns into support just below 31. This is as good a spot as any for a bottom in bond yields. All we need is an upside catalyst.
*****************************************************************
Thanks for tuning in and have a great weekend!
*****************************************************************

