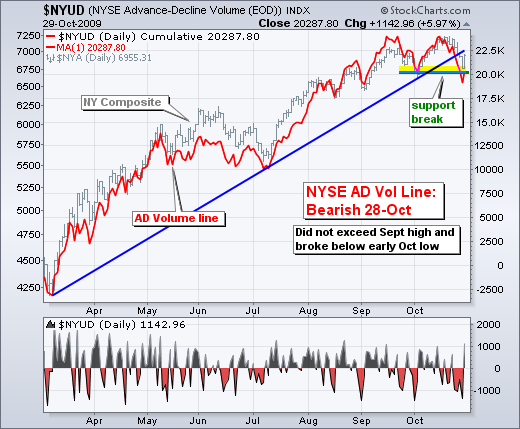
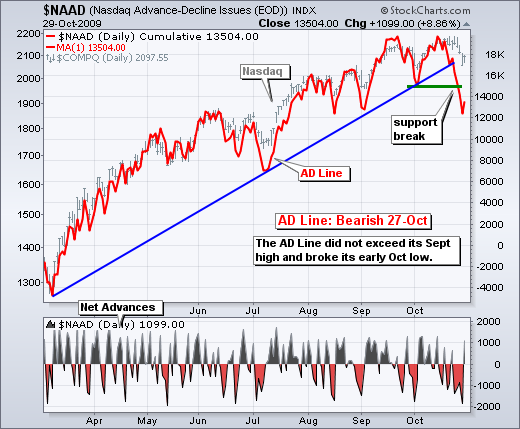
-Breadth chart page updated
-Short-Term SPY analysis in separate post below
-Medium-term evidence remains bullish, but....
-Wave 4 stalls for the S&P 500
-Nasdaq hits wave 4 resistance
-IWM breaks October low
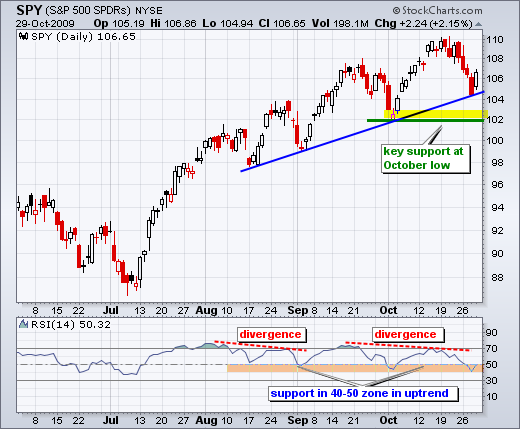
-SPY holds above October low
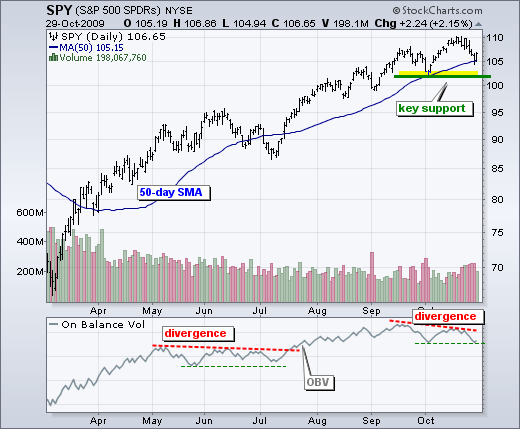
-OBV shows increase in downside volume
-Nasdaq AD Line breaks support
-Small-caps lead the way lower
-Click here for video page.
-Next Posting: Short-term SPY update on Mon AM.
*****************************************************************
Evidence Still Bullish, But...
The bulk of the evidence remains bullish for stocks, but more cracks are appearing in the bullish argument. Last week I noted that cracks were starting to appear. Instead of strengthening and filling these cracks, the market weakened and more cracks appeared this week. The bull is still standing, but the legs are getting shaky.
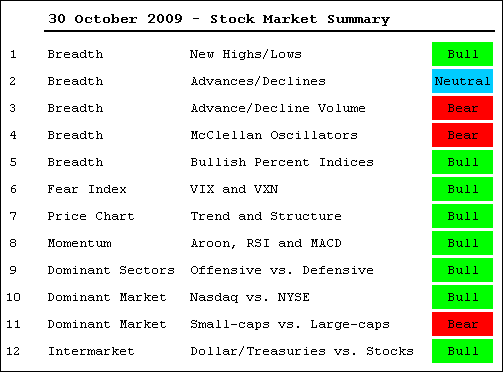
Keep in mind that the Stock Market Summary is designed to weigh the medium-term evidence. This means we should see just a few signals a year. The number of signals depends on volatility and the strength of a move. There have been four signals this year: bearish in February, bullish in March, bearish in July and bullish in July. Not all work as there was a whipsaw in July. I do not expect to catch the exact top by weighing the bulk of the evidence. Instead, I will know how to position myself for trading based on this evidence. With three bearish indicators, one neutral and eight bullish, the weight of the evidence is still bullish. However, it would not take much to flip a few of the remaining bullish indicators. In other words, we are nearing the make-or-break point for the medium-term uptrend. Either it holds near current levels or another push lower would break the bull's back.
*****************************************************************
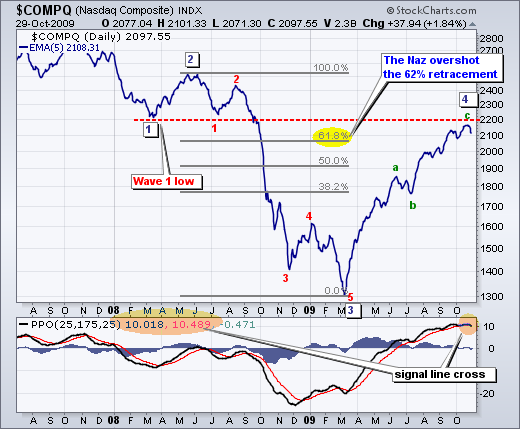
Elliott Wave for the Nasdaq and S&P 500
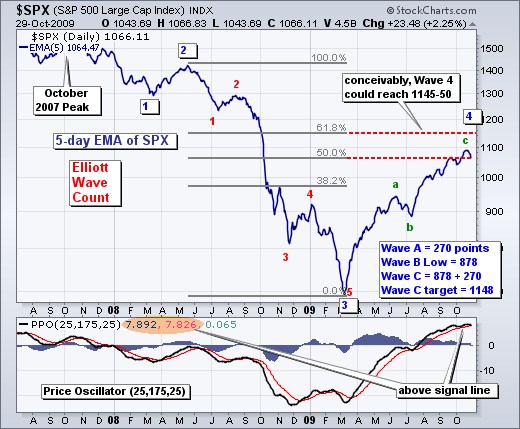
Looking at the wave structure for the S&P 500 over the last two years, the current advance still looks like Wave 4 of a five wave decline. According to Elliott, Wave 4 advances cannot exceed the low of Wave 1. The S&P 500 is still over 200 points from the Wave 1 low so that is not an issue right now. SPY is currently trading in the 50-62% retracement zone, which is where I would normally expect Wave 4 to end. SPX pulled back this week, but remains short of a medium-term trend reversal. Also notice that the Percentage Price Oscillator (25,175,25) remains above its signal line.
In contrast to the S&P 500, the Nasdaq is trading near the low of Wave 1. In fact, the index met resistance near this broken support area in mid October. If this in indeed Wave 4, then the Nasdaq should not exceed 2200. A move above this level would suggest an alternative wave count, which happens often with Elliott Wave theory. While the Nasdaq has yet to reverse the Wave 4 uptrend, notice that the Percentage Price Oscillator (PPO) moved below its signal line for the first time since late March. In addition, a small negative divergence formed in Sep-Oct. While the Nasdaq moved above its September high, the PPO did not and formed a lower high.
*****************************************************************
Medium-term Uptrends Remain in Place
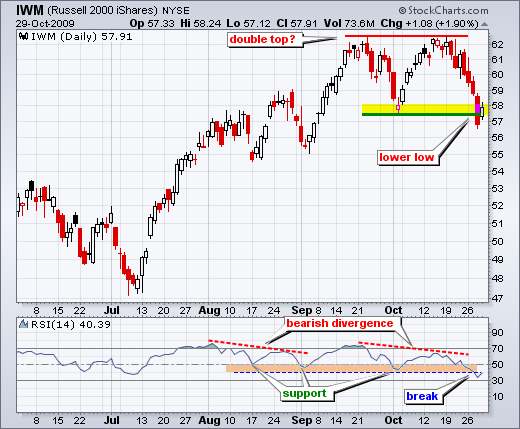
Despite signs of weakness in various indicators, the major index ETFs have yet to reverse their medium-term uptrends. Namely, they all remain above their early October lows, which mark key support. Remember, a downtrend consists of lower lows and lower highs. These must be present before considering the trend down. The Russell 2000 ETF (IWM) broke below its early October low on Wednesday, but recovered on Thursday and closed back above the support break. Nevertheless, a lower low did form and this ETF is the weakest of the major index ETFs. Also notice that a double top is taking shape over the last two months.
In contrast to IWM, the S&P 500 ETF (SPY) held above its early October low this week and bounced at the August trendline. This keeps the series of higher lows, and the uptrend, in place. I am leaving key support at 102 for now. In fact, I would even suggest a support zone around 102-104. A break below this support zone would reverse the current uptrend. The bottom indicator window shows RSI trading in the 40-50 zone for the fourth time since August. This zone marked support during the uptrend. A break below 40 would show the most downside momentum since July. Notice that RSI for IWM already broke below 40.
*****************************************************************
Warning Signs Abound
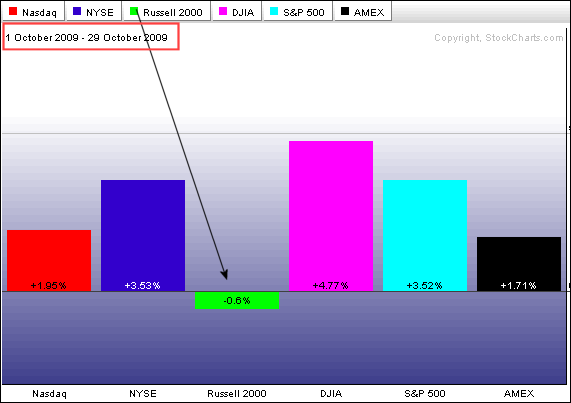
There are lots of warnings signs appearing in various indicators. First, small-caps are showing relative weakness as the Russell 2000 ($RUT) led the major index ETFs lower over the last two weeks. The Major US Indices Perfchart shows the Russell 2000 in negative territory for October. Even though all indices are well off their October highs, the others remain in positive territory. This shows that small-caps bore the brunt of recent selling pressure, which is not a good sign. Small-caps can be considered a leading indicator. Smaller companies are more sensitive to the economy and less diverse than large-caps. They usually feel the heat first.
Breadth is also starting to deteriorate with breakdowns in the NYSE AD Volume Line and the Nasdaq AD Line. After failing to confirm new reaction highs in the underlying indices, both broke below their early October lows this week. Even though the NY Composite and Nasdaq remain above their early October lows, the recent support breaks in these two indicators suggest further weakness ahead. Breadth, also referred to as the market internals, shows what is happening under the hood. The market engine is still running bullish, but not firing on all cylinders.
OBV for the S&P 500 ETF (SPY), Dow Diamonds (DIA) and Russell 2000 ETF (IWM) formed a bearish divergence in September-October. On Balance Volume (OBV) is a cumulative volume measure that adds volume on up days and subtracts volume on down days. The lower high in October shows less volume on up days. Also notice that OBV is already testing its October low. Volume on down days is also picking up.
*****************************************************************
Thanks for tuning in an have a great weekend!
*****************************************************************

