After a pretty good bounce on Thursday, stocks gave it all back with an even bigger decline on Friday. This kind of price action is not normal for a bull market or medium-term uptrend. First, Thursday's bounce only lasted one day. Second, the next day's decline broke the prior low as SPY closed below 104. Technically, the medium-term uptrend remains in play as long as the prior reaction low holds (102).
However, the bulk of the medium-term evidence is slowly shifting from bullish to bearish. Even though the bulls still hold a slight edge after Friday's decline, I think that edge will shift to the bears in the next 1-2 weeks. This means the medium-term trend is currently in transition and we could see choppy trading the next few days or weeks.
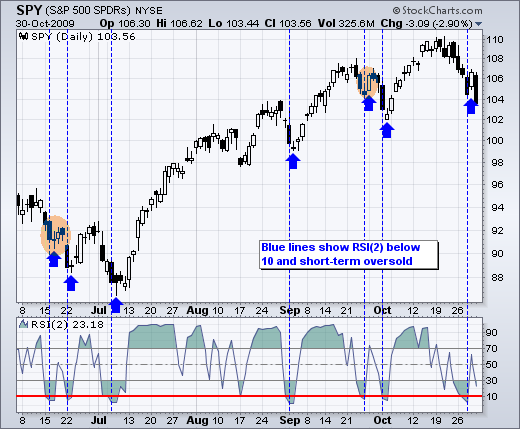
On the SPY chart, RSI(2) dipped below 10 last Wednesday for an oversold reading. Larry Connors developed a mean-reversion strategy that advocates buying when RSI(2) dips below 10 and the medium-term trend is up. Buying on Thursday morning looked like a good trade until the bottom fell out on Friday. Despite Friday's decline, it would have been possible to exit with a small loss or at breakeven. Once SPY moved above 106 on Thursday, traders could have reset their stops or booked partial profits. With SPY below 104 and RSI(2) below 30 at the close on Friday, I think another mean reversion trade is in play. Notice that RSI(2) now has a small bullish divergence working. A long trade would involve buying a positive open and setting a stop just below Friday's close. This is a short-term play with above average risk.
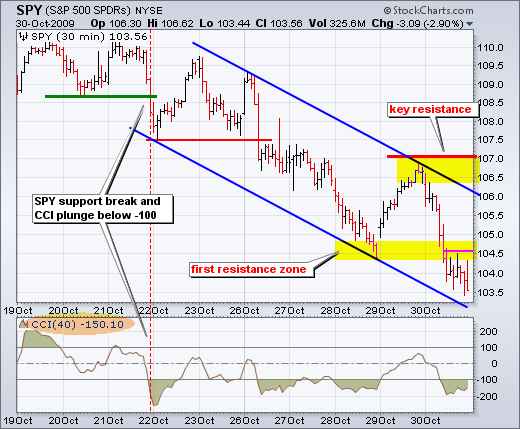
On the 30-minute chart, the short-term trend is clearly down. However, SPY is short-term oversold and nearing the lower channel trendline. Broken supports around 104.6 turn into the first resistance zone. While a break above this area would be positive, it would still be viewed as an oversold bounce within a downtrend. Key resistance is set at 107. Look for SPY to break 107 and CCI to break +100 to fully reverse the downtrend. I changed the CCI look-back period to 40. I was using CCI(20) on the 60-minute chart. It makes sense to double the timeframe with a 30-minute chart. Notice that CCI(40) moved below -100 on 21-Oct and has yet to exceed +100. This captures downside momentum quite well.


