-Bulk of the evidence remains bullish
-IWM leads the pack
-SPY extends short-term uptrend
-Past MACD divergences in SPY
-MACD diverges for QQQQ
-Autozone (AZO) firms at support
-Oracle (ORCL) recovers after sharp decline
-Qualcom (QCOM) bounces after hammer
-Comcast (CMCSA) firms after sharp decline
-Nvdia (NVDA) retraces 50% of prior advance
-Paychex (PAYX) firms at broken resistance
-Vulcan Materials (VMC) bounces on good volume
-Click here for the video page
-Next commentary: Friday, October 23rd
*****************************************************************
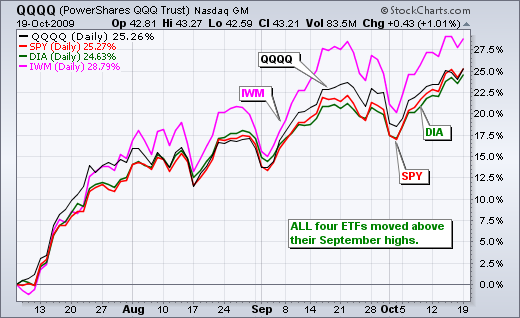
The bulk of the medium-term evidence remains bullish, but stocks are getting short-term overbought after sharp advances. SPY and IWM are up just over 7% over the last 11 days, DIA is up 6.42% and QQQQ is up 5.4%. QQQQ is up the least and showing a little relative weakness. I am not too concerned because the strength in SPY-IWM-DIA stems from leadership in the finance and consumer discretionary sectors. Also notice that IWM is up the most over the last few months.
The combination of medium-term bullish and short-term overbought makes it a tricky trading environment. Ideally, I look for short-term pullbacks and support tests to find bullish setups with a good risk-reward ratio. With the advance over the last 11 days, these setups are few and far between. While breakouts and new highs are technically bullish, they do not offer the best risk-reward ratio or trading setup. In any case, we should still expect bullish resolutions as long as the medium-term evidence remains bullish.
*****************************************************************
Short-term Uptrend Extends
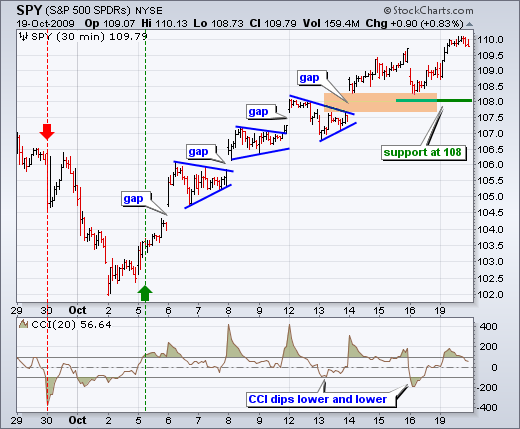
As the 30-minute chart shows, the short-term up trend remains in place with a series of higher highs and higher lows. SPY gapped down on Friday, but firmed and rebounded above last week's high on Monday. A higher low formed on Thursday, while a higher high formed on Monday. Notice that the gap zone around 108 turned into support. This support zone was highlighted in Friday's commentary. With Thursday's reaction low, I am now marking key support at 108. A break below this level would reverse this up trend.
The bottom window shows the Commodity Channel Index (CCI) plunging below -100 on Thursday and recovering with a surge above +100 on Monday. This is why I combine SPY price action and the indicator to confirm signals. Even though CCI dipped below -100, SPY held the gap support zone. Momentum is weakening as CCI dips lower and lower over the last five days. There was a dip to -99 on the 13th and the then a dip below -100 on the 16th. Another dip below -100 and move below 108 in SPY would reverse this short-term uptrend.
*****************************************************************
Another Bearish Divergence Brewing
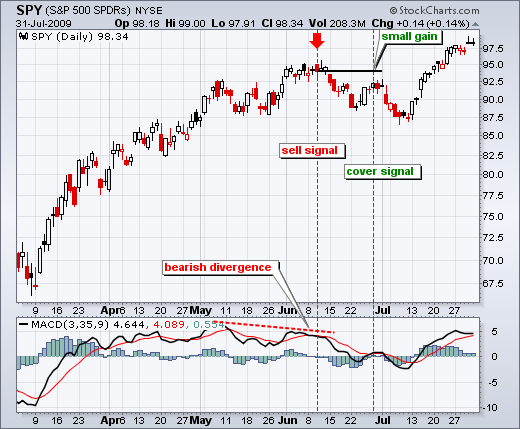
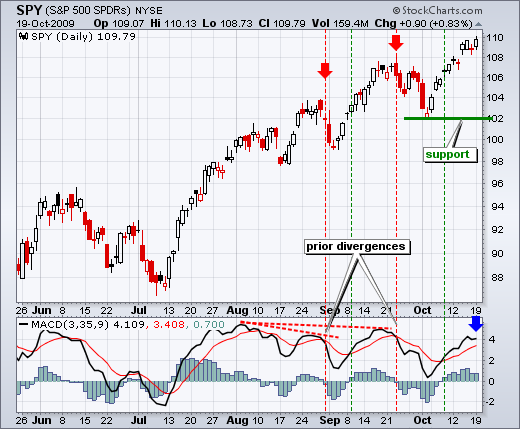
A lot is being made of the bearish divergences brewing in a number of key momentum oscillators. SPY moved to a new closing high this week, but MACD and RSI have yet to exceed their prior highs. Even though bearish divergences are normal in an extended uptrend, taking the signals would have resulted in a few small losses. You can control risk and limit losses even while on the wrong side of the uptrend. The next two charts show MACD (3,35,9) with the three bearish divergence signals since the March rally. A bearish signal is trigger with a bearish divergence and a signal line cross (red dotted lines). Notice that the MACD histogram turns negative with a signal line cross. Bearish signals were reversed when MACD moved back above its signal line (green dotted line). The mid July signal resulted in a small gain, but the late August and late September signals resulted in small losses.
MACD (3,35,9) has another bearish divergence brewing within a strong uptrend. A sell signal has yet to be triggered because MACD remains above its signal line. One of these signals will turn out to be a dandy, but there may still be a few whipsaws to be had (bad signals). Just remember to use you stops and set realistic expectations. I should also point out that I am using MACD (3,35,9) as opposed to MACD (9,26,9), which is the default setting in SharpCharts. I adjusted MACD to increase sensitivity, which produces more signals.
*****************************************************************
QQQQ with bearish divergence working
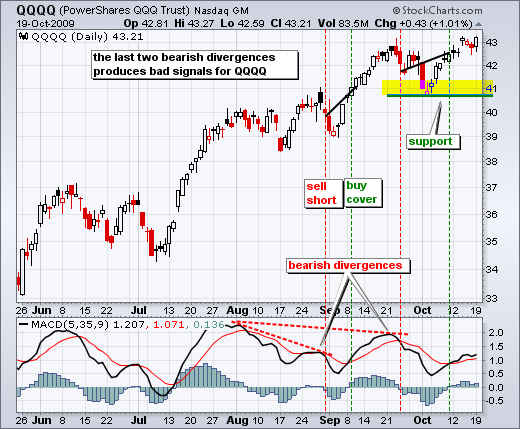
QQQQ, IWM and DIA also have bearish divergences working with RSI and MACD. For reference, I am showing the Nasdaq 100 ETF (QQQQ) with MACD (5,35,9). The last two signals in late August and late September resulted in loosing trades. The black line connecting the short-sale price and the buy-cover price slopes up, which means QQQQ was higher when MACD moved back above its signal line. Another alternative stop-loss would be to set a breakeven stop if the position becomes profitable by 2% or more. QQQQ moved over 2% lower after the short-sale signals, but rebounded above the original entry point 4-10 days later.
*****************************************************************
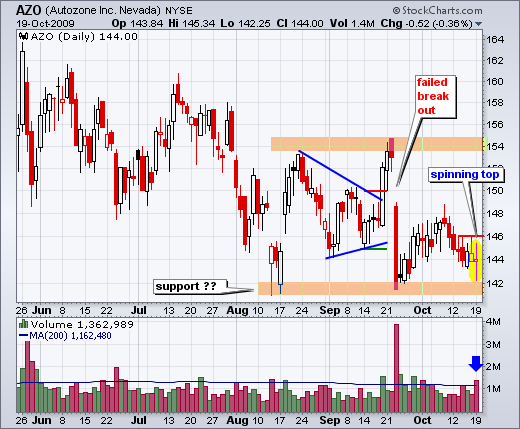
Autozone (AZO) forms big spinning top near support. Autozone was featured just before the breakout at 150 and this breakout failed after a negative reaction to earnings. The stock gapped down and formed a long red candlestick that closed near the August low. After an oversold bounce back to 148, AZO returned to support over the last two weeks. A large spinning top formed on Monday with high volume. This shows indecision at support. Indecision after a decline can foreshadow a reversal. Watch for a move above 146 to affirm support and target a move towards resistance around 155.
*****************************************************************
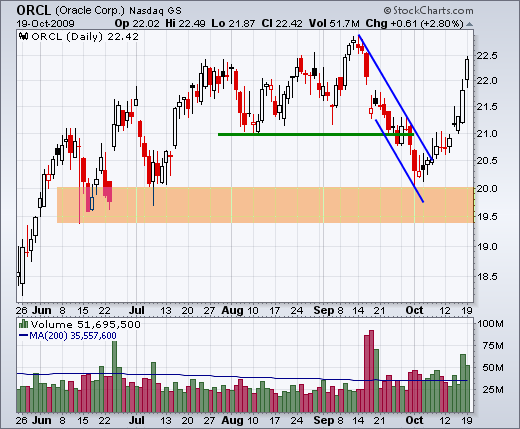
Oracle (ORCL) shows what can happen in a bull market. The bulk of the evidence was bullish for stocks, but Oracle got hit hard in September with a sharp decline to 20. ORCL broke the August lows, but managed to firm near the Jun-Jul lows around 19.5-20. After a little indecision in early October, ORCL broke channel resistance two weeks ago and surged over the last four days. I show this chart as an example of realistic market expectations. Even after declines, we should look at individual stock charts with bullish-colored glasses. In other words, the odds favor a bullish resolution when the bulk of the evidence is bullish for the stock market.
*****************************************************************
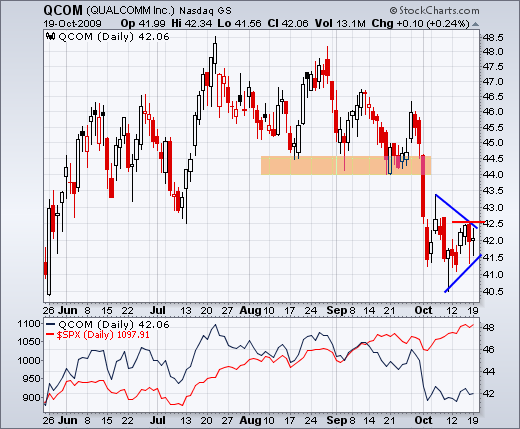
With the Oracle example in mind, I have singled out a few stocks that are oversold and firming. Qualcom (QCOM) was hit hard with a plunge below 42 and then firmed over the last two weeks. A long hammer formed seven days ago and a triangle took shape over the last two weeks. Look for a break above 42.5 to signal the start of an oversold bounce.
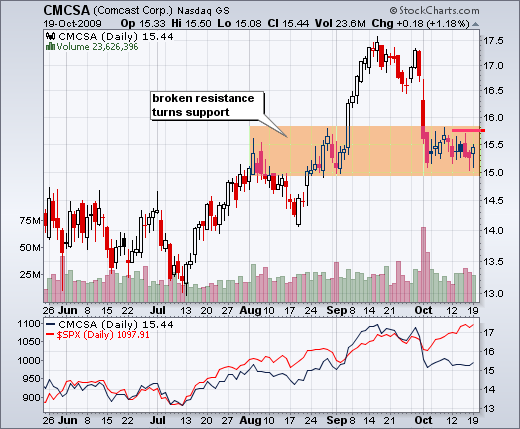
Comcast (CMCSA) at the end of September and then firmed over the last two weeks with a tight consolidation. Look for a move above 15.8 to signal a short-term breakout.
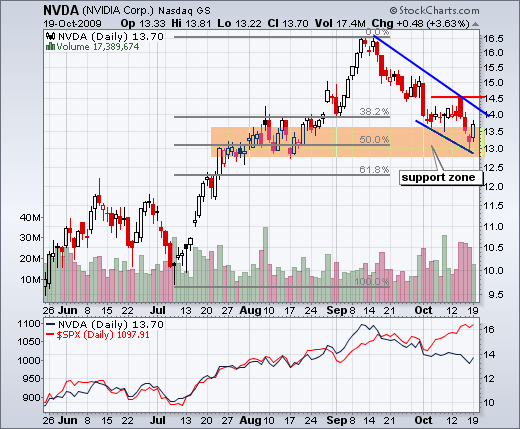
After peaking in mid September, Nvdia (NVDA) declined back to the August support zone with a falling wedge that retraced 50% of the prior advance. The stock fell on high volume last week, but firmed on Friday and rebounded on Monday. A one day rebound is not quite enough to reverse the 4-5 week slide. Follow through above 14.3 is need to break the wedge trendline.
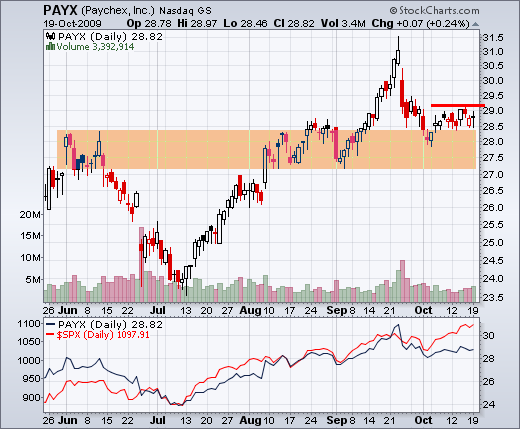
After a breakout in September, Paychex (PAYX) fell back to broken resistance and this area is acting as support. The stock firmed the last two weeks and a break above 29.2 would be short-term bullish.
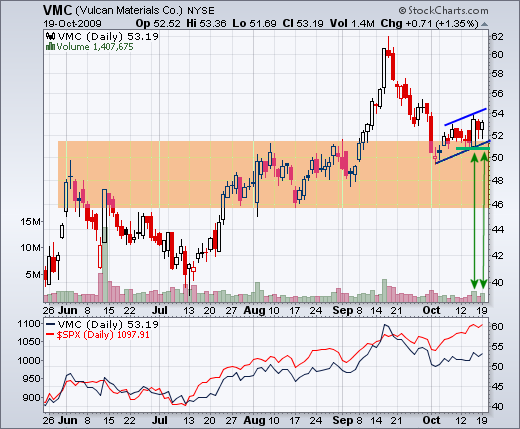
Vulcan Materials (VMC) broke resistance in September and returned to the breakout in early October. After a sudden decline, the stock is firming around 50-52 support. VMC surged last week with pretty good volume and edged higher on Monday, again with pretty good volume. A short-term uptrend is underway with support at 51. Higher prices are expected as long as this uptrend holds. Even though the two weeks advance looks like a bearish flag, it would not reverse unless there is a break below last week's low.
*****************************************************************
Thanks for tuning in and have a great day!
*****************************************************************

