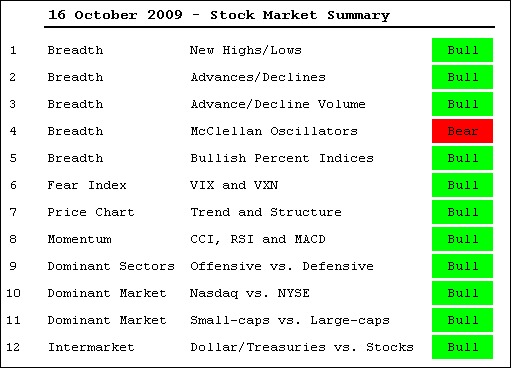
-Bulk of the evidence remains bullish
-SPY surges to new highs in October
-S&P 500 enters retracement zone on weekly chart
-NYSE AD Line hits new high
-VIX moves to new low
-MACD stays bullish despite divergences
-Russell 2000 and S&P 100 exceed September highs
-Bullish percent indices are all above 50%
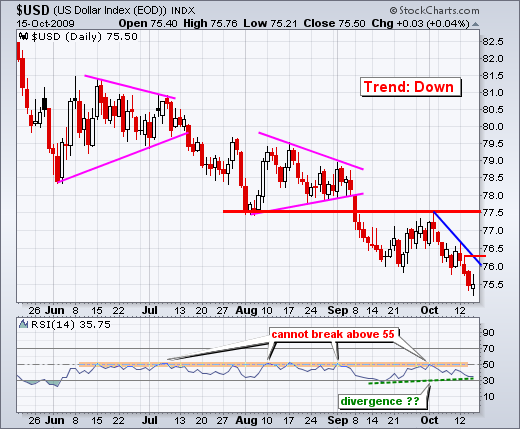
-Dollar records yet another new low
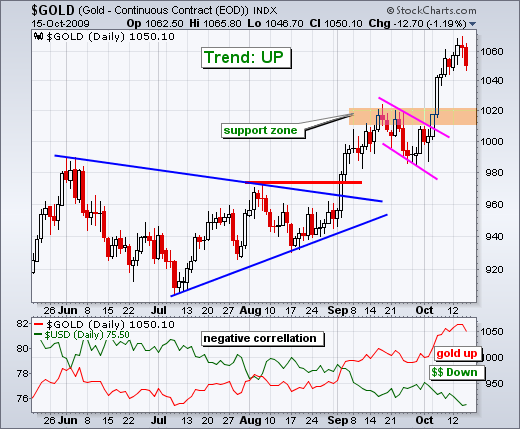
-Gold remains bullish, but short-term overbought
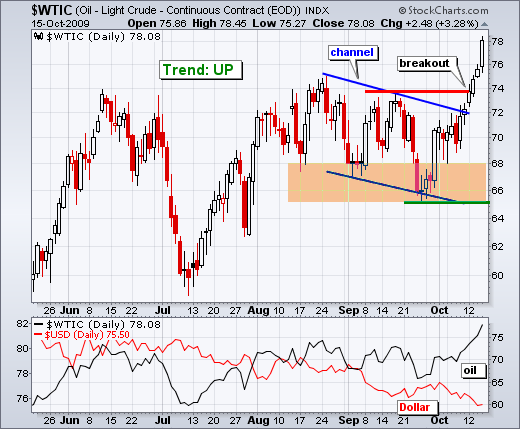
-Oil breaks channel resistance
-Bonds test key support zone
-Click here for video page.
-Next Commentary: Tuesday, October 20th
*****************************************************************
The bulk of the evidence remains bullish for stocks. SPY remains is in an uptrend on daily chart (medium-term) and 30 minute chart (short-term). The trend on the weekly chart is questionable (long-term) because the S&P 500 is trading in the middle of its three year range. My main focus remains the daily chart, which covers the medium-term trend. This medium-term uptrend will be expected to continue as long as the bulk of the evidence is bullish. A trend in motion stays in motion. In truth, nobody knows now long or how far a trend will extend. The best we can do it identify and follow until proven otherwise.
*****************************************************************
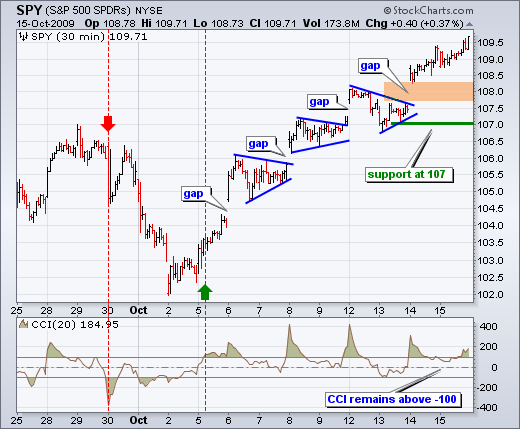
Demand is clearly outstripping supply in October. The chart below shows the S&P 500 ETF with 30 minute bars. SPY gapped up on October 5th, consolidated with a triangle and continued higher. This gap-triangle-breakout combo repeated two more times. We have yet to see a consolidation after Wednesday's gap as SPY continued higher the last two days. With a move from 102 to 109.5, the ETF is up over 7% in 9 days. Overbought? Maybe. Strong? Clearly. The gap zone around 108 turns into the first support zone to watch. For now, I am marking short-term support at 107. CCI moved back above +100 to affirm the short-term uptrend that began on October 5th. CCI has yet to break below -100 since this uptrend began. For a short-term reversal, I would look for CCI to break -100 and SPY to break 107.
*****************************************************************
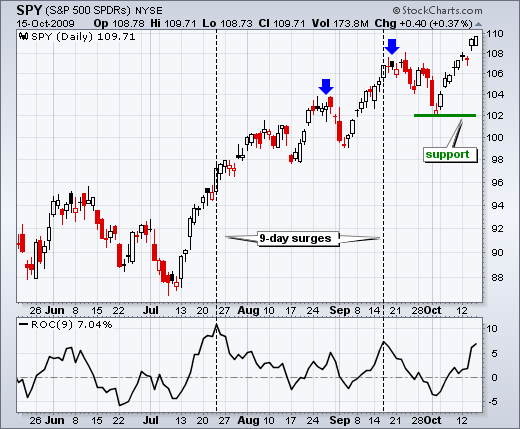
Demand is also outstripping supply over the last three months. The daily chart shows SPY with a series of higher highs and higher lows since August. With the current move above 108, the ETF forged yet another higher high to confirm the uptrend. Even though the uptrend is confirmed, this 9-day advance is getting long in tooth. As the blue arrows show, there were pullbacks after the last two higher highs. At this point in the uptrend, the odds of a short-term pullback have increased significantly.
*****************************************************************
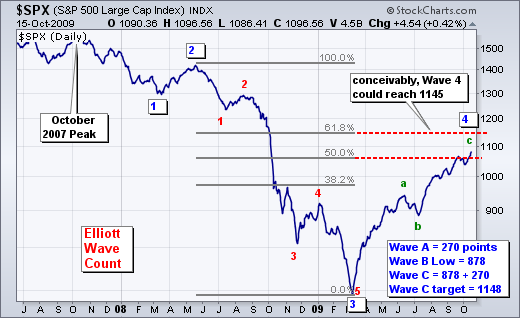
The S&P 500 is entering a key retracement zone on the weekly chart. The 62% retracement marks the next upside target around 1145. I still "think" we are in a Wave 4 advance of a 5 wave decline. Wave 4 is taking on an ABC pattern. Wave C can be equal to Wave A, which would project a move to around 1148. See the math on the actual chart. As long as the medium-term evidence remains bullish, the 1140-1150 area marks the next target for the S&P 500. If the S&P 500 hits this target, then we can expect new highs in the other major indices as well.
*****************************************************************
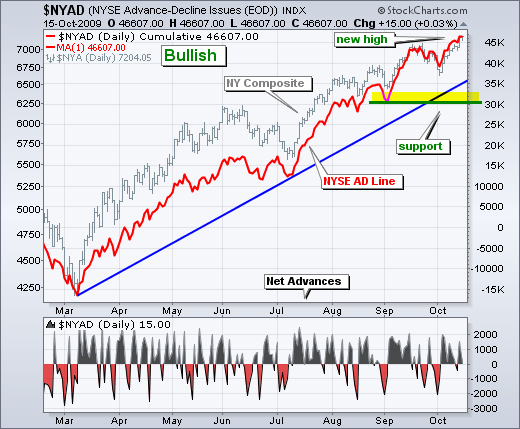
Breadth remains bullish overall. The AD Line and AD Volume Line for the Nasdaq are challenging their September highs and in clear uptrends. The AD Line for the NYSE hit a new high for year. New 52-week highs continue to outpace new 52-week lows on both the Nasdaq and the NYSE. Except for a less upside momentum, which is reflected by weakness in the McClellan Oscillators, there are simply no signs of weakness in these indicators.
*****************************************************************
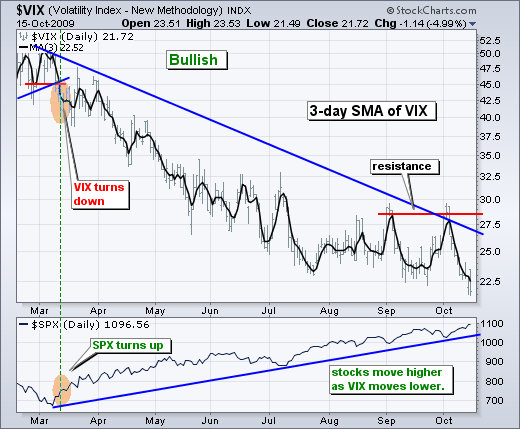
The S&P 500 Volatility Index ($VIX) and the Nasdaq 100 Volatility Index ($VXN) reflect an absence of fear, which is conducive to buying (demand). The VIX moved to a new low as the S&P 500 hit a new high for the year. Some may consider this a sign of complacency, but there is a clear inverse correlation between the volatility indices and the stock market. Stocks rise as volatility falls. Remember, volatility is a measure of risk. The lower the risk, the easier it is to buy. These volatility indices may hit extremes that show complacency, but that day has yet to get here. The VIX traded between 10 and 20 for most of 2006. Currently, the VIX remains above 20.
*****************************************************************
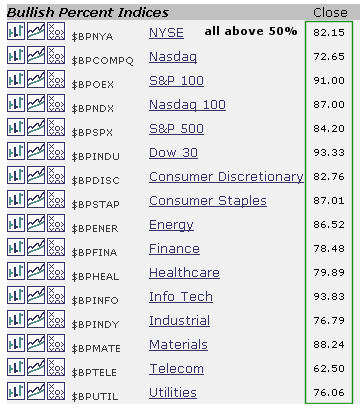
All of the bullish percent indices are above 50%. These indices measure the percentage of stocks on a Point&Figure buy signal. Except for telecom, all are above 70% and most are above 80%. The bullish percents for the S&P 100, Dow Industrials and Technology sector are all above 90%. Readings above 90% may be considered overbought, but don't forget that overbought is a sign of strength, not weakness. The bullish percent table can be found at the bottom of the market summary page.
*****************************************************************
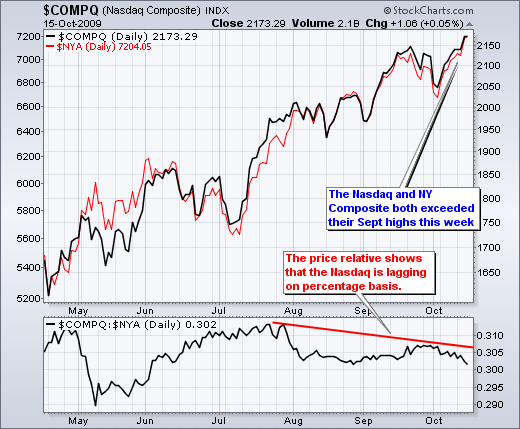
The Nasdaq and the NY Composite both recorded new highs for the year this week. Based on higher highs and higher lows, the Nasdaq is keeping pace with the NY Composite. However, the price relative shows the Nasdaq lagging the NY Composite on a percentage basis. Notice that the price relative formed a lower high in late September. Which one do we believe? I am going to favor the price charts. Both hit new highs this week and this shows bullish confirmation, as opposed to non-confirmation. Both the Russell 2000 (small-caps) and the S&P 100 (large-caps) recorded new highs this week as well.
*****************************************************************
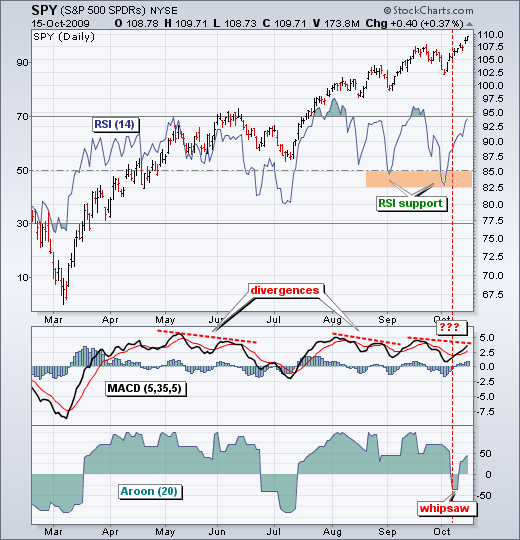
Momentum remains bullish overall. Using the S&P 500 ETF as the market proxy, I am showing three momentum oscillators: MACD, RSI and Aroon. First, RSI bounced off its support zone and moved back towards 70 in October. Second, MACD remains in positive territory. Even though another bearish divergence may be brewing, MACD remains above its signal line and prior divergences resulted in whipsaws (bad signals). A bearish divergence will work one day, but the strong uptrend in SPY holds the real power here.
The Aroon oscillator dipped into negative territory last week, but recovered and turned positive again on Monday. However, notice that SPY, RSI and MACD were rebounding as Aroon dipped into negative territory (red dotted line). These rebounds offset the negative signal from the Arooon Oscillator. Using more than one indicator can help build consensus that filters out wayward signals.
*****************************************************************
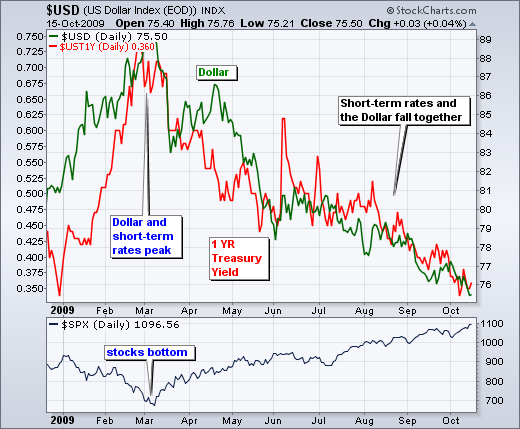
The Dollar moved to a new reaction low this week as the S&P 500 hit a new reaction high. The "risk ON" trade remains in play. This means that players are selling the Dollar and putting the proceeds to work in riskier assets like stocks and commodities. Expect this trade to continue as long as short-term rates trend lower. While some pundits may lament over the demise of the Dollar, a falling Dollar actually stimulates exports and hence the economy. So do low interest rates.
The downtrend in the Dollar is as strong as the uptrend in stocks. Oversold and a bullish divergence are only possible positives for the Dollar. RSI dipped below 30 in mid September and is so far holding above this level in October. However, we need to see a break above 55 to turn momentum bullish. For the Dollar, I am marking short-term resistance at 76.3 and medium-term resistance at 77.5.
*****************************************************************
Gold remains bullish overall, but looks vulnerable to a short-term pullback or consolidation after two big advances. The Gold-Continuous Futures ($GOLD) advanced from 940 to 1060 with two big moves in less than two months. Gold's last big move occurred in October with a flag breakout around 1020. This prior resistance zone now turns into the first support zone to watch. At this stage, I think it prudent to wait for a pullback or bullish setup to emerge before anticipating another leg higher.
*****************************************************************
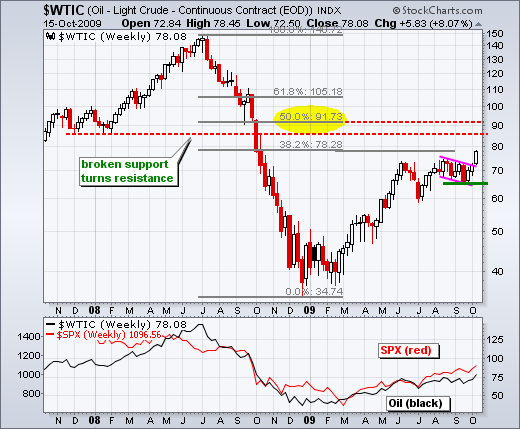
This week's big news is the channel breakout in West Texas Intermediate ($WTIC). Oil surged from 66 to 78 over the last three weeks. Prior to this surge, oil failed to take advantage of Dollar weakness and stock market strength. No more. The channel break affirms the current uptrend and targets a move towards 88-92 area. On the weekly chart, the 50% retracement and broken support mark this zone.
*****************************************************************
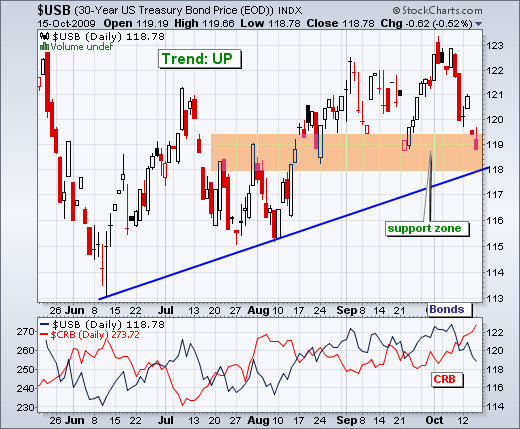
The surge in oil and other commodities took its toll on the bond market as the 30-year Treasury Bond ($USB) fell back to support around 118-119. This decline puts $USB at its moment-of-truth. The June trendline, broken resistance and the September lows combine to mark a support zone in this area. Further weakness below 118 would reverse the current uptrend.
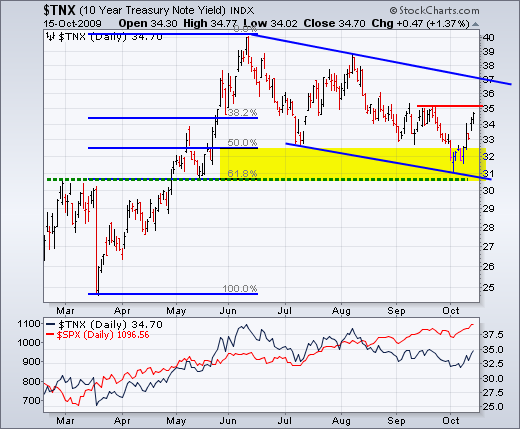
The 10-Year Treasury Yield ($TNX) found support near the 62% retracement and broken resistance (31 or 3.1%). The surge over the last two weeks is quite impressive and I will be watching for follow through to break above the September highs. A breakout in long-term rates would likely coincide with a surge in short-term rates, which could give a boost to the Dollar. A boost to the Dollar could weigh on stocks. It hasn't happened yet, but it is something we should keep an eye on.
*****************************************************************
Thanks for tuning in and have a great weekend!
*****************************************************************

