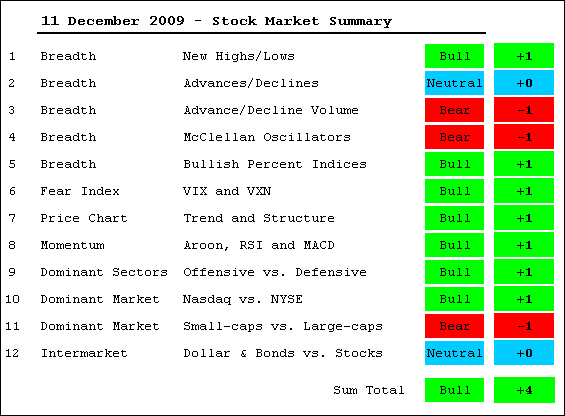
With stocks trading flat over the last 4-5 weeks, not much has changed for the stock market. There are still more new 52-week highs than new 52-week lows. The NYSE AD Line recorded a new high for the year. Volatility remains subdued as the VIX and VXN test their October lows. The overall trends are up with SPY, DIA and QQQQ within spitting distance of their 2009 highs. Momentum has slowed over the last few months, but is still positive overall. Even though the finance sector is lagging, the technology, industrials and consumer discretionary sectors are holding up just fine. The Nasdaq has even started outperforming the NY Composite again as techs got a lift this week. Despite a few bearish indicators out there, I still think the bulk of the evidence remains bullish. I will run through some of these indicators after the jump.

*****************************************************************
Breadth: Mixed. These indicators were covered in a separate post today.
Bullish Percent Indices: Bullish. These were covered in a separate post today.
*****************************************************************
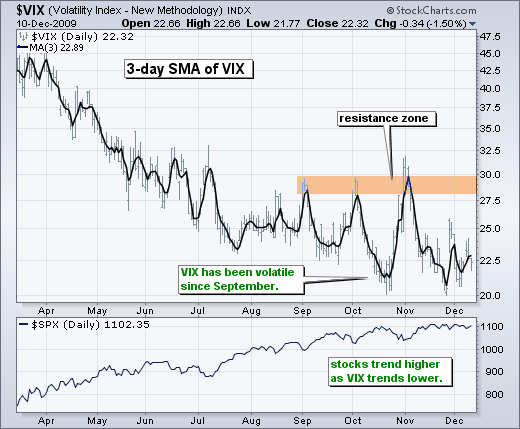
Fear Index: Bullish. The S&P 500 Volatility Index ($VIX) and Nasdaq 100 Volatility Index ($VXN) are near their October lows and in downtrends overall.
*****************************************************************
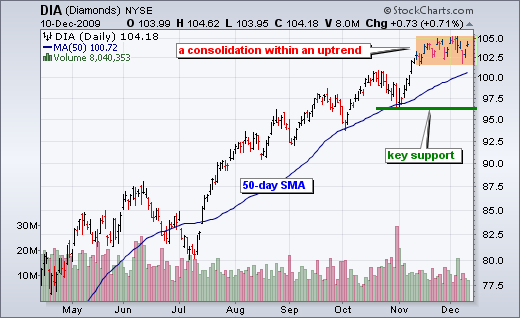
Price chart: Bullish. DIA, SPY and QQQQ are in overall uptrends and have been consolidating the last four weeks. Consolidating just means there is a stalemate between bulls and bears. There are no real signs of selling pressure unless we see range support breaks across the board.
*****************************************************************
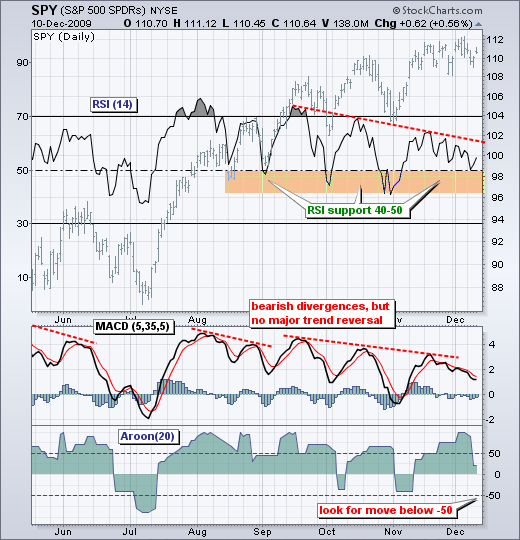
Momentum: Bullish. RSI has held the 40-50 zone since August and this level holds the key to bullish RSI. The indicator is currently testing the top of this support zone. MACD has bearish divergences extending back to summer, but this just shows slowing upside momentum. We have yet to see downside momentum overpower upside momentum with a move into negative territory. Even though the Aroon Oscillator pulled back from the +50 range, it remains in positive territory and bullish overall.
*****************************************************************
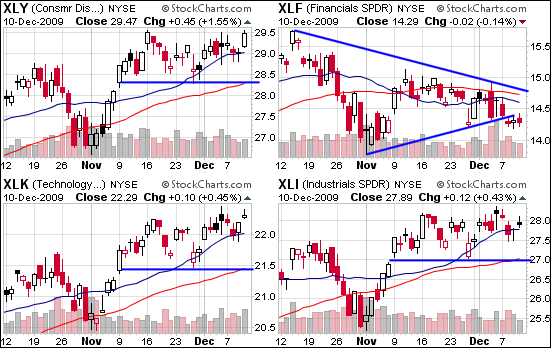
Offensive vs. Defensive Sectors: Bullish. The Financials SPDR (XLF) remains a concern as it underperforms the broader market, but the other three offensive sectors are holding up well.
*****************************************************************
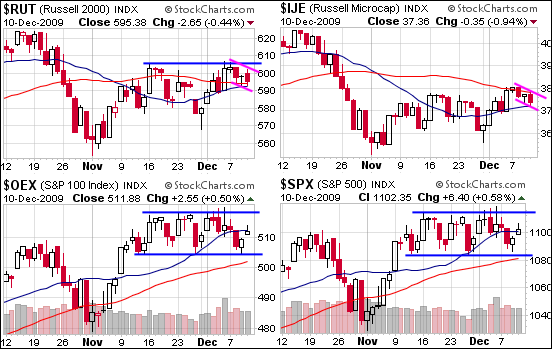
Small-caps vs. Large-caps: Bearish. Small-caps are still underperforming large-caps over the last two months. The Russell 2000 ($RUT) and Russell Microcap Index ($IJE) perked up in early December and the January effect is due in mid December. Historically, small-caps have outperformed large-caps from mid December to end January. RUT and IJE pulled back over the last three days with small falling flag patterns. Look for breakouts to signal a continuation of the early December advance and a small-cap revival.
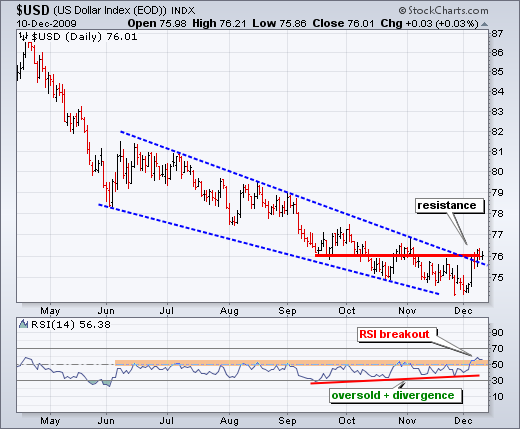
A falling Dollar has coincided with a rising stock market since March. Therefore, I would view a Dollar reversal as negative for the stock market. After a surge last week, the US Dollar Index ($USD) stalled around 76 and a continuation higher would reverse the downtrend. Notice that RSI broke above 55 for the first time since April.
*****************************************************************
Breadth: Mixed. These indicators were covered in a separate post today.
Bullish Percent Indices: Bullish. These were covered in a separate post today.
*****************************************************************
Fear Index: Bullish. The S&P 500 Volatility Index ($VIX) and Nasdaq 100 Volatility Index ($VXN) are near their October lows and in downtrends overall.

*****************************************************************
Price chart: Bullish. DIA, SPY and QQQQ are in overall uptrends and have been consolidating the last four weeks. Consolidating just means there is a stalemate between bulls and bears. There are no real signs of selling pressure unless we see range support breaks across the board.

*****************************************************************
Momentum: Bullish. RSI has held the 40-50 zone since August and this level holds the key to bullish RSI. The indicator is currently testing the top of this support zone. MACD has bearish divergences extending back to summer, but this just shows slowing upside momentum. We have yet to see downside momentum overpower upside momentum with a move into negative territory. Even though the Aroon Oscillator pulled back from the +50 range, it remains in positive territory and bullish overall.

*****************************************************************
Offensive vs. Defensive Sectors: Bullish. The Financials SPDR (XLF) remains a concern as it underperforms the broader market, but the other three offensive sectors are holding up well.

*****************************************************************
Small-caps vs. Large-caps: Bearish. Small-caps are still underperforming large-caps over the last two months. The Russell 2000 ($RUT) and Russell Microcap Index ($IJE) perked up in early December and the January effect is due in mid December. Historically, small-caps have outperformed large-caps from mid December to end January. RUT and IJE pulled back over the last three days with small falling flag patterns. Look for breakouts to signal a continuation of the early December advance and a small-cap revival.
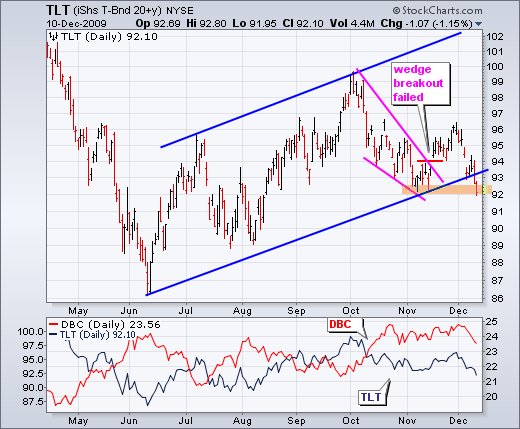
Dollar/Bonds vs. Stocks: Neutral. Bonds show signs of weakness, but the Dollar shows signs of strength. A decline in bonds translates into a rise in long-term rates, both of which are viewed as bullish for stocks. First, money moving out of bonds has to go somewhere. Second, rising rates could point to strength in the economy. The Fed is not going to raise rates unless the economy shows strength. The 20+ Year Treasury ETF (TLT) failed to hold the wedge breakout and returned all the way to the November low. TLT broke the June trendline in the process and does not look healthy right now.

A falling Dollar has coincided with a rising stock market since March. Therefore, I would view a Dollar reversal as negative for the stock market. After a surge last week, the US Dollar Index ($USD) stalled around 76 and a continuation higher would reverse the downtrend. Notice that RSI broke above 55 for the first time since April.

*****************************************************************

About the author:
Arthur Hill, CMT, is the Chief Technical Strategist at TrendInvestorPro.com. Focusing predominantly on US equities and ETFs, his systematic approach of identifying trend, finding signals within the trend, and setting key price levels has made him an esteemed market technician. Arthur has written articles for numerous financial publications including Barrons and Stocks & Commodities Magazine. In addition to his Chartered Market Technician (CMT) designation, he holds an MBA from the Cass Business School at City University in London.
Learn More


