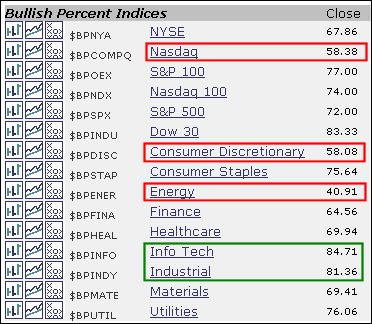
The Bullish Percent Indices tell us the percentage of stocks in an index that have Point & Figure buy signals. There are many ways to interpret these numbers. Analysts can look at the absolute numbers. In general, readings above 50% favors the bulls, while reading below 50% favor the bears. Some analysts look for overbought and oversold levels. Readings above 70% are deemed overbought, while readings below 30% are deemed oversold. As with momentum oscillators, Bullish Percent Indices can remain overbought in a strong uptrend or oversold in a strong downtrend. Analysts can also look at general direction and apply technical analysis to the Bullish Percent Indices. A rising Bullish Percent Index shows underlying strength, while a falling Bullish Percent Index shows underlying weakness.
Looking at the absolute numbers, there is clearly more strength than weakness in the current market. The Nasdaq Bullish Percent Index (58.38%) is the lowest, while the Dow BPI is the highest (83.33%). As confirmed with weakness in the Nasdaq AD Line, the rank-and-file Nasdaq stocks are not keeping pace with Nasdaq large-caps. Within the sectors, the consumer discretionary and energy sectors are the weakest, but only the energy sector shows a Bullish Percent Index below 50%. Info technology and industrials are the strongest with readings above 80%. Again, the only sign of real weakness is in the energy sector. Now let's look at some individual charts.
The S&P 500 Bullish% Index has been trending lower since September, but remains comfortably above 50%. While this is technically a bearish divergence, we must keep in mind that over 70% of the S&P 500 stocks are on P&F buy signals. That ain't shabby. The brief dip below 50% in early July turned out to be a bear trap as the indicator surged back above 50% quite quickly.

The Nasdaq 100 Bullish% Index remains well above 50%, but is not nearly as strong as it was in September. This shows narrowing participation on the latest advance above 1750. Even so, 70% participation is still enough to fuel an advance.

The Consumer Discretionary Bullish% Index ($BPDISC) remains above 50%, but is trending lower over the last two months. There is a huge bearish divergence working as XLY moved higher from October to early December. A break above 65% is needed to reverse the fall in the BPI. Even though I am quite concerned with the bearish divergence, it still takes a move below 50% to turn fully bearish.

The Energy Bullish% Index is in a downtrend and below 50%, which is unequivocally bearish. Only a move above 55% would be considered enough to reverse this slide.

Even though the finance sector is relatively weak and the Bullish Percent Index is trending down, the BPI remains well above 50% and XLF is still above support from the Sep-Oct-Nov lows. A break above 70% in the BPI would be bullish.

The Healthcare SPDR (XLV) surged in November with a 15% gain, but the Bullish Percent Index remained flat. Over 67.5% of stocks remained on P&F buy signals. Evidently, the right stocks remained on P&F buy signals to continuing fueling the rally. A break below 67.5% would show underlying weakness that could give way to a top.


