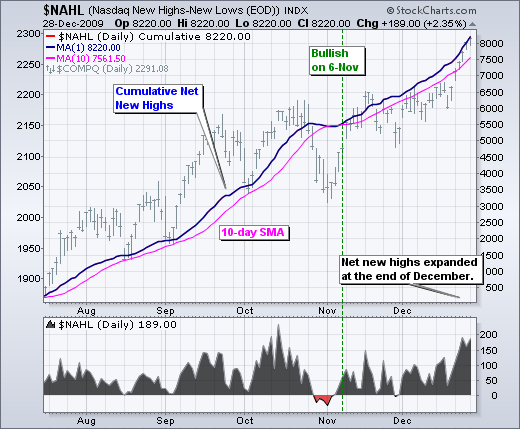
Net New Highs expanded at the end of December. NYSE new 52-week highs exceeded +350 on Monday and this is above the November peak. Nasdaq Net New Highs exceeded +150, which is also above the November peak. More new 52-week highs shows broadening participation in the December advance. Needless to say, the cumulative Net New Highs lines are rising and above their 10-day SMA.
*****************************************************************
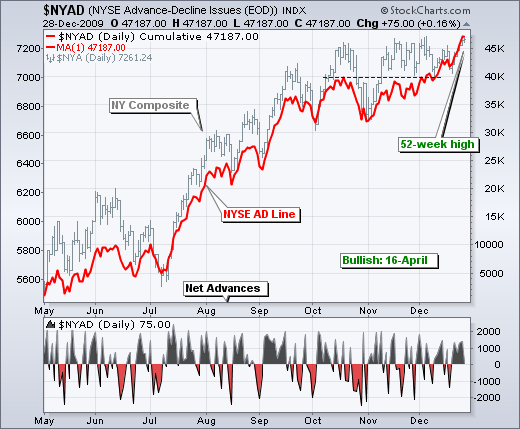
The NYSE AD Line hit another new 52-week high, but Nasdaq AD Line continues to lag. The NYSE AD Line broke above its October high in early December and never looked back. This shows relative strength in small and mid-caps within the NYSE. The Nasdaq AD Line is lagging because it remains well below its October high. Relative weakness in the Nasdaq AD Line is a concern, but it is counted by strength elsewhere.
*****************************************************************
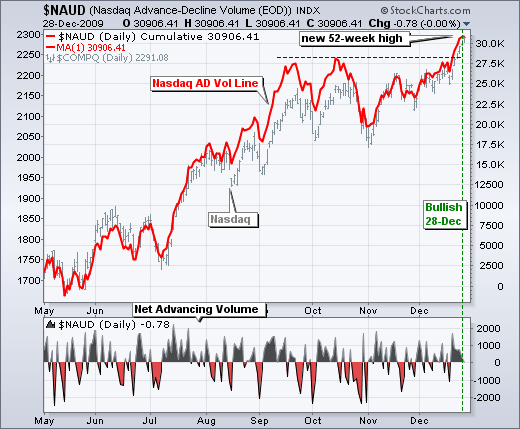
The Nasdaq AD Volume Line hit a new 52-week high as NYSE AD Volume Line challenges its Sep-Oct highs. With a little help from volume leaders like Apple (AAPL), Microsoft (MSFT) and Oracle (ORCL), the Nasdaq AD Volume Line shows underlying strength in large-caps. Even though the NYSE AD Volume Line did not yet exceed its Sep-Oct highs, the fact that it is near them shows more strength than weakness.
*****************************************************************
McClellan Oscillators surge above 50. For the first time since late July, the Nasdaq McClellan Oscillator surged above +50. This reverses the prior plunges below -50, of which there were four from August to October. The NYSE McClellan Oscillator surged above +50 for the first time since mid September. These surges above +50 show strength in the AD Lines over the last few weeks. It is also worth noting that the McClellan Oscillators have been positive for most of December, which also shows strength in the AD Line.
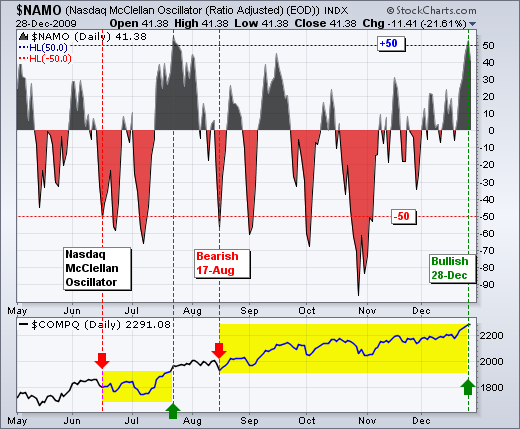
The McClellan Oscillator is the 19-day EMA of Net Advances less the 39-day EMA of Net Advances. It is positive when the 19-day EMA is above the 39-day EMA and negative otherwise. As the difference of two moving averages, this means the McClellan Oscillator acts like MACD, which is a momentum oscillator. I like to think of the McClellan Oscillator as a momentum oscillator for the AD Line. This means the McClellan oscillator is an indicator of an indicator, which makes it at least two steps removed from the underlying (Nasdaq Composite).
*****************************************************************
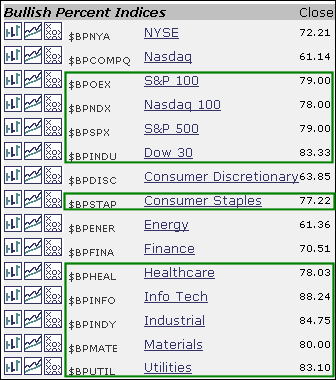
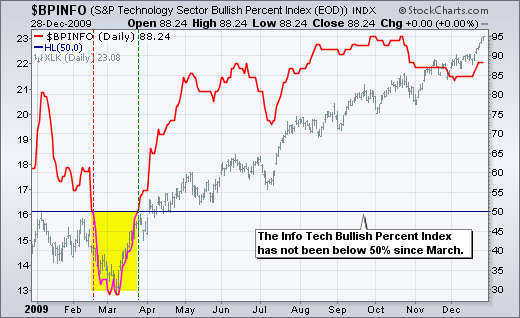
Bullish Percent Indices move higher. With SPY, DIA, QQQQ and IWM all trading at 52-week highs this week, it is no surprise that the Bullish Percent Indices also moved higher. This means more stocks moved to Point & Figure buy signals (breakouts). Bullish Percent Index readings above 50% favor the bulls. Anything over 50% is gravy, and there is a lot of gravy out there now. Of the major indices, Bullish Percent Indices for the S&P 100, Nasdaq 100, Dow and S&P 500 are above 75%. Of the nine sectors, six are above 75%. While the Consumer Discretionary Bullish% Index ($BPDISC) and Financial Sector Bullish% ($BPFINA) continue to lag, weakness is countered by strength elsewhere. The "market" is the sum total of all sectors. Therefore, the "market" is bullish when the majority of sectors are bullish.
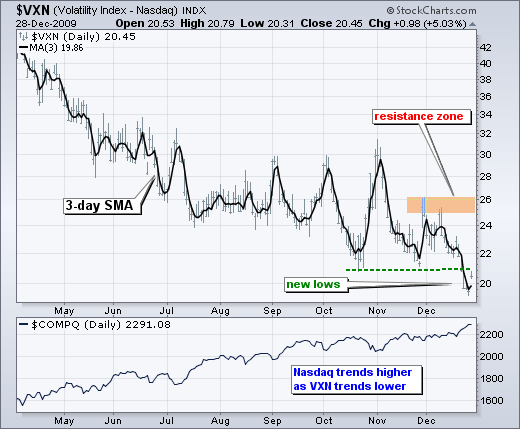
Volatility indices move to new lows. As the Nasdaq 100 and S&P 500 moved to new highs, the S&P 500 Volatility Index ($VIX) and Nasdaq 100 Volatility Index ($VXN) moved to new lows. This has been the trend since March: stocks rise as volatility declines. Therefore, I view the new lows in the volatility indices as bullish or positive for stocks. Those with a bearish bias will argue about complacency, but don't forget that VIX and VXN remain well above their 2007 lows, 10 and 15, respectively. 2007 complacency levels are still far away.
*****************************************************************
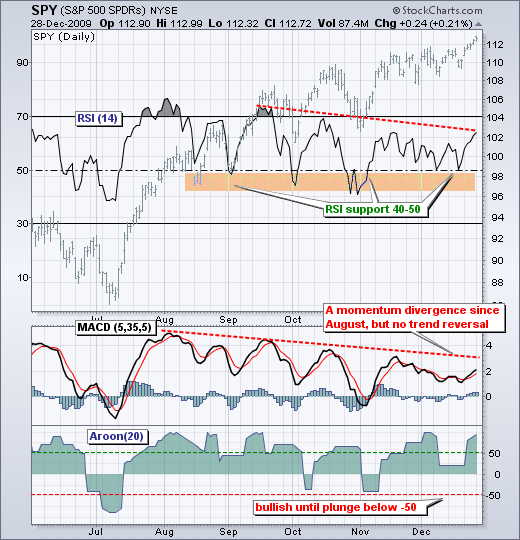
Trend and momentum are bullish. SPY shows nothing but higher highs and higher lows since the July bottom. This is the definition of an uptrend. Only a break below 107 would call for a reassessment. This chart also shows the three momentum indicators. RSI bounced off 50, MACD(5,35,5) held well above the zero line and Aroon has been positive since mid November. As noted before, upside momentum is not as strong as it was in August or September, but momentum is definitely more up than down. Look for RSI to break 40, MACD to break zero and Aroon to break -50 to turn momentum bearish.
*****************************************************************
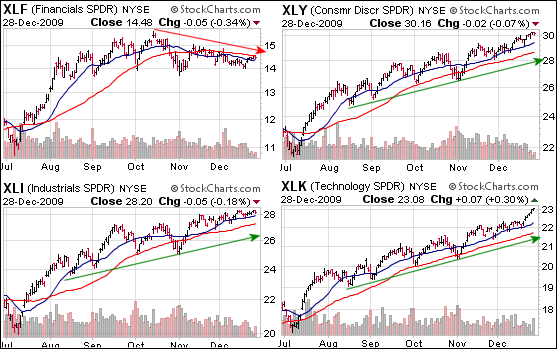
Offensive sectors show strength overall. The finance, consumer discretionary, industrials and technology sectors are considered the offensive sectors. In other words, the bulls are on the offensive when these sectors show relative strength. The healthcare, consumer staples and utilities sectors are the defensive sectors. The bulls are on the defensive when these sectors show relative strength. There are at least two ways to measure relative strength. First, we can look at percentage change and compare performance over a period of time. Second, we can compare the price charts for signs of underlying strength or weakness. I prefer to compare the price charts. The Industrials SPDR (XLI), Technology SPDR (XLK) and Consumer Discretionary SPDR (XLY) all moved to new 52-week highs the last few days. This shows underlying strength in three of the four offensive sectors, which is a clear majority that favors the bulls. The Financials SPDR (XLF) remains the laggard as it trades below its October and November highs. While I am concerned with relative chart weakness in XLF, relative chart strength in the other three sector ETFs prevails.
*****************************************************************
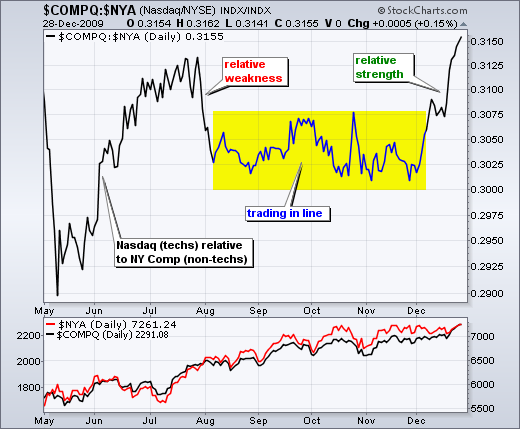
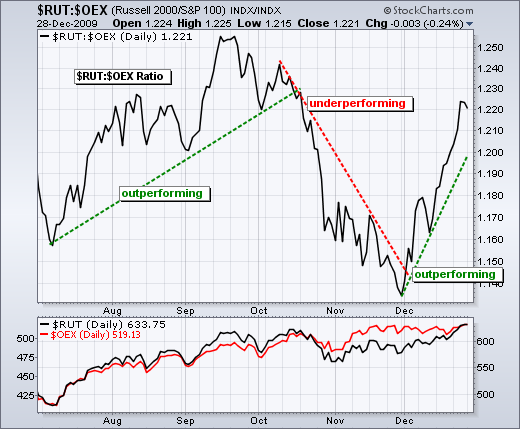
Techs and small-caps are leading the December charge. The appetite for risk is strong when techs and small-caps show relative strength. These two groups represent the higher-beta stocks that carry more risk - and potential reward. Money moving into riskier stocks shows an increase in investor confidence, which often accompanies an increase in buying pressure overall. The charts below show the Nasdaq (techs) relative to the NY Composite (non-techs) and the S&P 100 (large-caps) relative to the Russell 2000 (small-caps). Notice how the $COMPQ:$NYA and $RUT:$OEX ratios shot higher in December. These ratios are also known as the price relatives that compare the performance of two securities. The price relatives rise when the numerator ($COMPQ or $RUT) rises faster than the denominator ($NYA or $OEX).
*****************************************************************
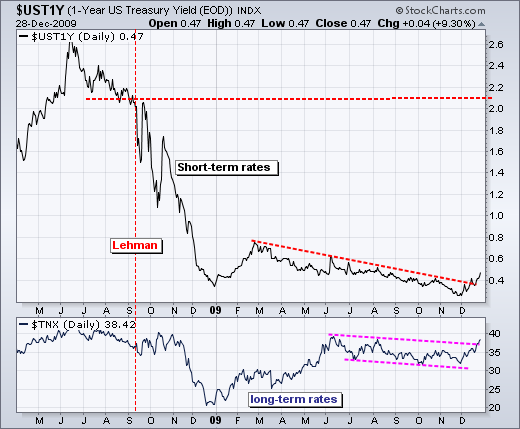
Rising rates and falling bonds are bullish for stocks. Before showing these charts, note that I am removing the Dollar from this equation. Despite a sharp rise in the Dollar over the last five weeks, stocks held strong and moved to new highs in late December. The inverse correlation between stocks and the Dollar appears to be ending. Rising rates and falling bonds point to strength in the economy. At some point, high interest rates can choke the economy, especially the housing sector. However, short-term rates are historically low and there is room to rise. The 1-Year Treasury Yield ($UST1Y) surged over the last five weeks and this shows increased confidence in the economy, and perhaps even in the financial system. Short-term rates fell sharply after the Lehman collapse and remained at low levels for over a year. The December rise in short-term rates shows increased confidence and further strength would be bullish for stocks. We could even see the 1-Year Treasury Yield move back to the 2% range (pre-Lehman levels). The bottom window shows the 10-Year Treasury Yield ($TNX) breaking channel resistance with a sharp move the last five weeks. This bullish breakout in rates is bearish for bonds.
*****************************************************************

