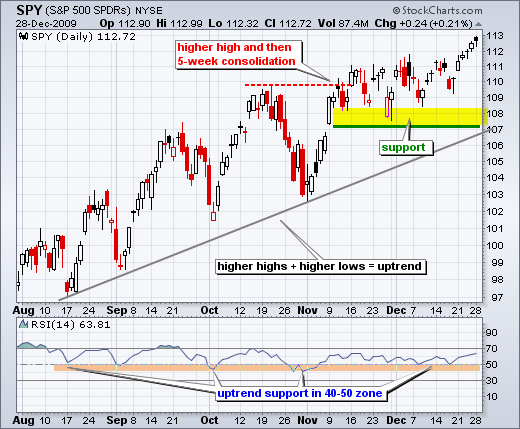
After a five day surge from 110 to 113, the S&P 500 ETF (SPY) took a breather on Tuesday with a small decline. SPY was trading in positive territory in the afternoon, but got hit with a late sell-off that pushed prices into negative territory. A small bearish engulfing pattern formed and the ETF is short-term overbought after its five day run. Even though these conditions could give way to a short-term pullback, there is nothing to suggest a medium-term trend reversal at this stage. Chart support at 107 is based on the consolidation lows and the August trendline.


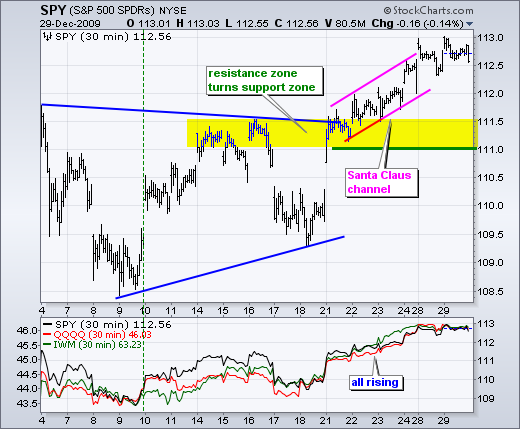
There is no real change on the 30-minute chart. Broken resistance around 111-111.5 turns into the first support zone to watch on a pullback. As noted above, SPY is short-term overbought and we could see a throw back to broken resistance. The next commentary will be on Monday, January 4th. Happy New Year!


About the author:
Arthur Hill, CMT, is the Chief Technical Strategist at TrendInvestorPro.com. Focusing predominantly on US equities and ETFs, his systematic approach of identifying trend, finding signals within the trend, and setting key price levels has made him an esteemed market technician. Arthur has written articles for numerous financial publications including Barrons and Stocks & Commodities Magazine. In addition to his Chartered Market Technician (CMT) designation, he holds an MBA from the Cass Business School at City University in London.
Learn More


