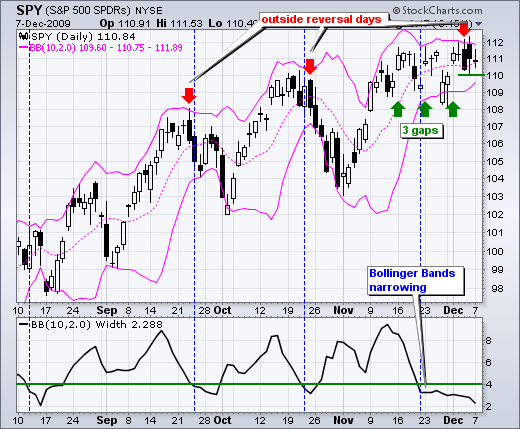
There is a difference between actual weakness and flat trading, especially within a bigger uptrend. I think we can all agree that SPY has been trending higher since early July, perhaps even since mid March. The ETF first crossed above 111 on November 16th and closed just below 111 on December 7th, 15 days later. SPY has crossed the 111 level at least seven times in the last three weeks. This amounts to a consolidation or indecisive period, which reflects equilibrium between buying pressure and selling pressure. With the bigger trend up, the bias is still bullish here. Furthermore, we have yet to see a significant increase in selling pressure. Even with the long black candlesticks on Thursday-Friday, SPY is still holding last week's gap.
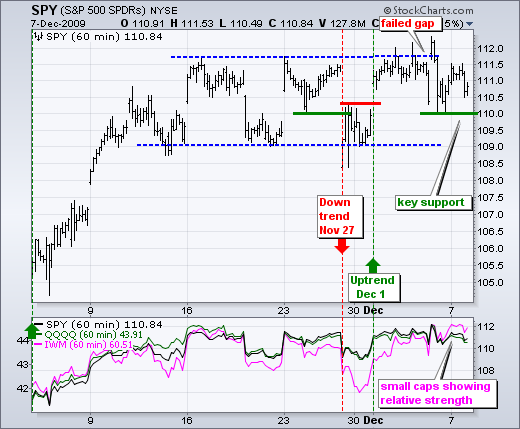
On the 60-minute chart, SPY failed to hold the breakout at 112, but held support at 110 on Friday and Monday. Even though the failed breakout is negative, the bulls have the edge as long as key support at 110 holds. The failure to hold the breakout shows diminished buying pressure. However, a break below support at 110 is needed to show an actual increase in selling pressure.

The indicator window shows SPY with the Nasdaq 100 ETF (green) and Russell 2000 ETF (pink). Small-caps are showing relative strength, while large-cap techs are showing relative weakness. Notice that the pink line (IWM) is above the black and green lines (SPY and QQQQ). I wrote about the January effect on December 1st. These seasonal curiosities seem to start earlier and earlier.


