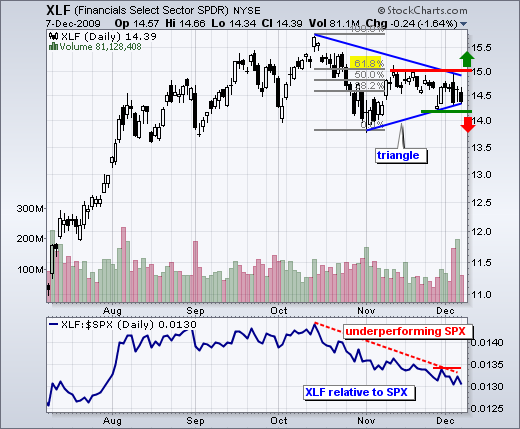
Although the energy and the finance sectors are not related, both are clearly the weakest of the nine sector SPDRs over the last two months. The Financials SPDR (XLF) is more important to the overall market. You know the drill. While SPY moved to a new reaction high in November, XLF formed a lower high and then moved into a consolidation pattern. Since early November, trading in XLF has been confined to the 14-15 range. A subsequent break from this range will provide a strong clue on overall market direction.


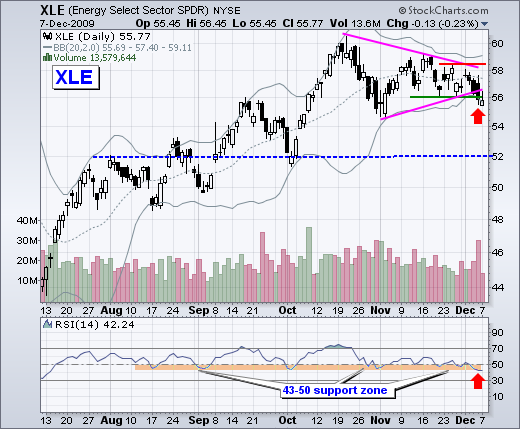
The chart for the Energy SPDR (XLE) looks similar to XLF as a consolidation also formed over the last seven weeks. XLE broke below triangle support late last week and RSI broke to its lowest level since July (red arrows). The next support zone is around 52.

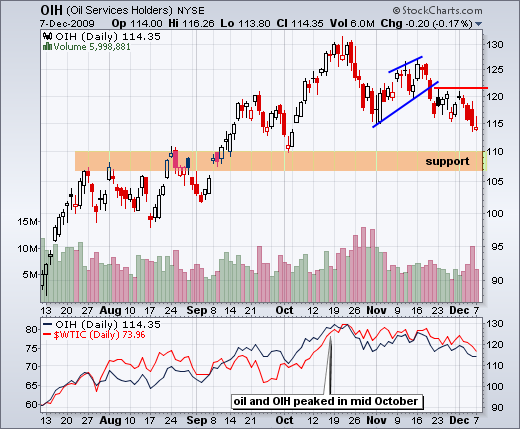
The Oil Service HOLDRs (OIH) is actually weaker than XLE because it already broke below its early November low. Oil services are seen as a leading indicator for oil. As such, relative weakness in OIH is not a good sign for oil or XLE.


The Oil Service HOLDRs (OIH) is actually weaker than XLE because it already broke below its early November low. Oil services are seen as a leading indicator for oil. As such, relative weakness in OIH is not a good sign for oil or XLE.


About the author:
Arthur Hill, CMT, is the Chief Technical Strategist at TrendInvestorPro.com. Focusing predominantly on US equities and ETFs, his systematic approach of identifying trend, finding signals within the trend, and setting key price levels has made him an esteemed market technician. Arthur has written articles for numerous financial publications including Barrons and Stocks & Commodities Magazine. In addition to his Chartered Market Technician (CMT) designation, he holds an MBA from the Cass Business School at City University in London.
Learn More


