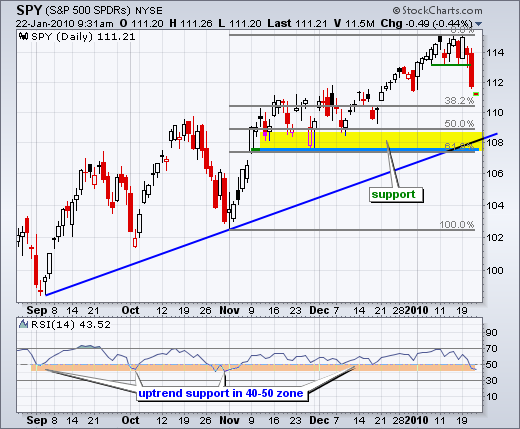
After consolidating around 114 for a couple weeks, SPY broke short-term support with a long red candlestick on Thursday. Even though this looks like a convincing support break, it is still just a short-term phenomenon because the medium-term trend remains up. With a medium-term uptrend still underway, a short-term downtrend is considered a correction within the bigger uptrend. Estimating the extent of pullbacks within a bigger uptrend is tricky because the bigger uptrend carries more weight. How far might this correction extend? Using the Fibonacci Retracements Tool and the prior consolidation, the first target is around 110-111, which is marked by the 38% retracement and the top of the consolidation (late Nov to early Dec). The second target is around 108-109, which is marked by the 50-62% retracement and the bottom of the consolidation.


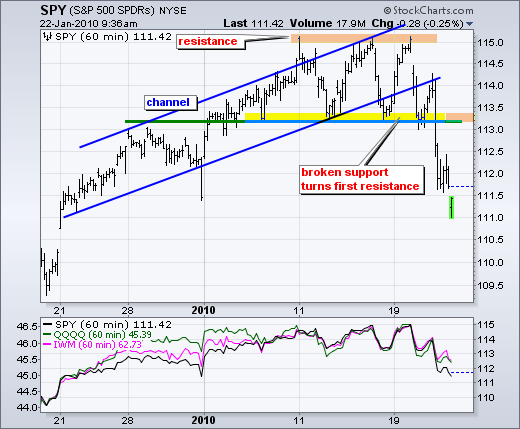
On the 60-minute chart, SPY broke support with a sharp decline over the last few days. After stalling on Thursday afternoon, the ETF continued lower in early trading on Friday. SPY is now down around 4 points in less than three days and getting short-term oversold. Should an oversold bounce materialize, look for broken support to turn into the first resistance zone around 113-113.5.


About the author:
Arthur Hill, CMT, is the Chief Technical Strategist at TrendInvestorPro.com. Focusing predominantly on US equities and ETFs, his systematic approach of identifying trend, finding signals within the trend, and setting key price levels has made him an esteemed market technician. Arthur has written articles for numerous financial publications including Barrons and Stocks & Commodities Magazine. In addition to his Chartered Market Technician (CMT) designation, he holds an MBA from the Cass Business School at City University in London.
Learn More


