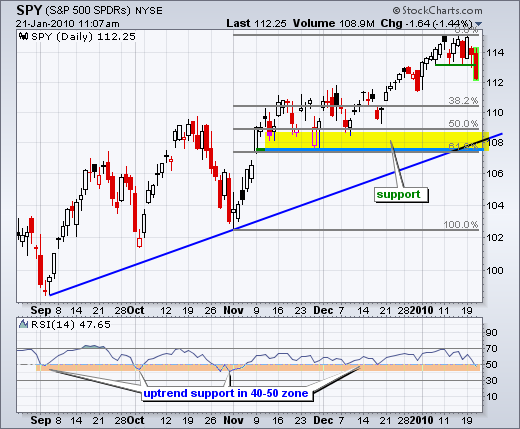
Even though the trend on the daily chart remains up, SPY broke short-term support and a correction appears to be unfolding. With the short-term support break, we can now start estimating a downside target for this correction. The last big move extends from the early November low to the early January high. A 50-62% retracement of this advance would extend to the 108 area. There is also support in this area from the late November lows and the September trendline. It is also possible that SPY finds support a little higher. Perhaps the first support level will materialize in the 110 area.

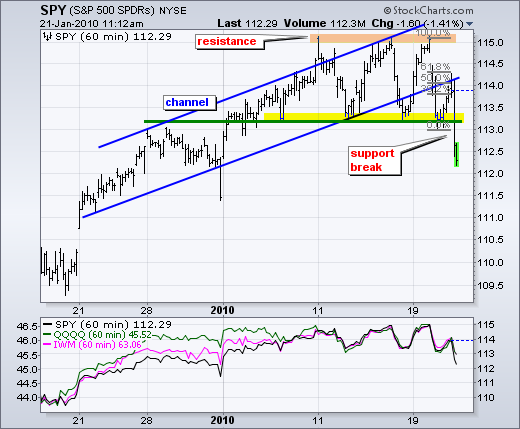
On the 60-minute chart, SPY clearly broke support with a sharp decline on Thursday. A short-term downtrend is now underway with downside targets shown on the daily chart above. Broken support around 113.2 turns into the first resistance level to watch. It is also worth noting the setup over the last two days. First, SPY gapped down and briefly pierced support on Wednesday morning. Second, the subsequent bounce in the afternoon retraced 62% with a move to around 114.3. The 62% retracement marked the reversal point for this bounce as SPY continued lower on Thursday.


On the 60-minute chart, SPY clearly broke support with a sharp decline on Thursday. A short-term downtrend is now underway with downside targets shown on the daily chart above. Broken support around 113.2 turns into the first resistance level to watch. It is also worth noting the setup over the last two days. First, SPY gapped down and briefly pierced support on Wednesday morning. Second, the subsequent bounce in the afternoon retraced 62% with a move to around 114.3. The 62% retracement marked the reversal point for this bounce as SPY continued lower on Thursday.


About the author:
Arthur Hill, CMT, is the Chief Technical Strategist at TrendInvestorPro.com. Focusing predominantly on US equities and ETFs, his systematic approach of identifying trend, finding signals within the trend, and setting key price levels has made him an esteemed market technician. Arthur has written articles for numerous financial publications including Barrons and Stocks & Commodities Magazine. In addition to his Chartered Market Technician (CMT) designation, he holds an MBA from the Cass Business School at City University in London.
Learn More


