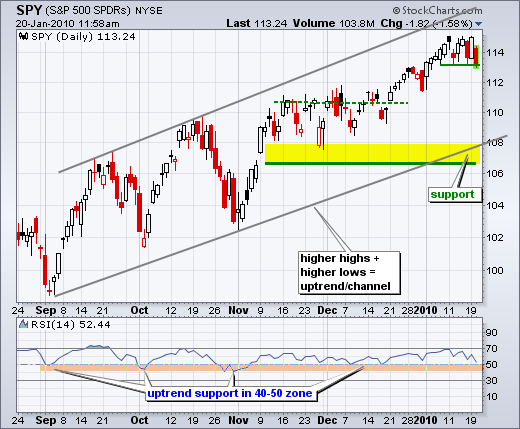
The medium-term uptrend is not in jeopardy at this point, but there is a clear battle raging around 114 as SPY crossed this level six times in the last eight days. Three of the downside crosses featured some intense selling pressure. Last Tuesday's decline occurred with a gap and sizable loss. Friday's decline featured a long red candlestick and sizable loss. Today (Wednesday), the ETF gapped down and moved below 114 with another long red candlestick in early trading. Selling pressure is clearly mounting and this could give way to a pullback towards broken resistance around 111.


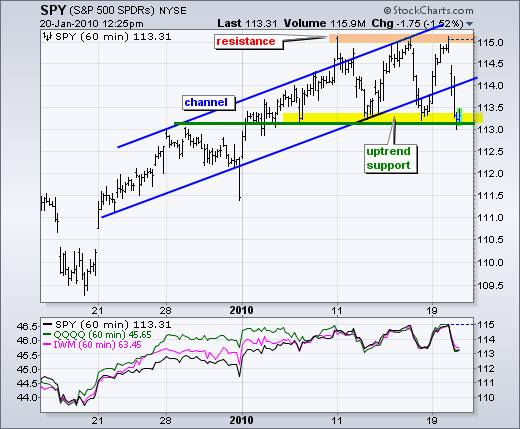
On the 60-minute chart, SPY gapped down and declined to support around 113-113.5 in early trading. Even though Friday's channel break did not look significant, this channel break does look important. The bulls showed resilience with Tuesday's surge back to 115. However, the immediate decline back to support suggests that Tuesday's surge was a fluke. A break below the support zone would open the door to the 111-111.5 area.


About the author:
Arthur Hill, CMT, is the Chief Technical Strategist at TrendInvestorPro.com. Focusing predominantly on US equities and ETFs, his systematic approach of identifying trend, finding signals within the trend, and setting key price levels has made him an esteemed market technician. Arthur has written articles for numerous financial publications including Barrons and Stocks & Commodities Magazine. In addition to his Chartered Market Technician (CMT) designation, he holds an MBA from the Cass Business School at City University in London.
Learn More


