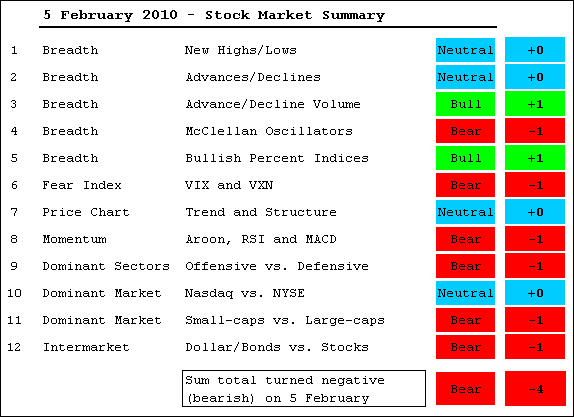
I started this evidence table in September and the bulk of the evidence was net positive from September to January. Signs of weakness started appearing in the second half of January and the evidence turned net negative this week. To the model's credit, the evidence stayed net positive during the October decline and the rally resumed in early November. This year's decline, however, appears to have done enough technical damage to reverse the evidence. While there could certainly be a counter trend rally, the evidence suggests that this rally will stop short of the prior high and a downtrend is currently underway. There is a bullet list of comments after the jump and I have post more details in today's Market Message.

-Both McClellan Oscillators plunged below -50 in late January.
-The Nasdaq AD Line broke support and turned bearish in late January.
-The AD Volume Lines weakened considerably, but remain in uptrends overall.
-The Bullish Percent Indices took a big hit, but all remain above 50%. These are lagging/coincident indicators.
-The volatility indices surged above 25 with big gains on Thursday.
-DIA and SPY broke below support from the late November lows.
-The NY Composite is leading lower. Even though this means the Nasdaq shows "relative strength", the technology shows relative weakness among the key sectors.
-XLF broke support and XLK shows relative weakness.
-Small-caps show relative weakness.
-The Dollar and Bonds are rising in a flight to safety.


