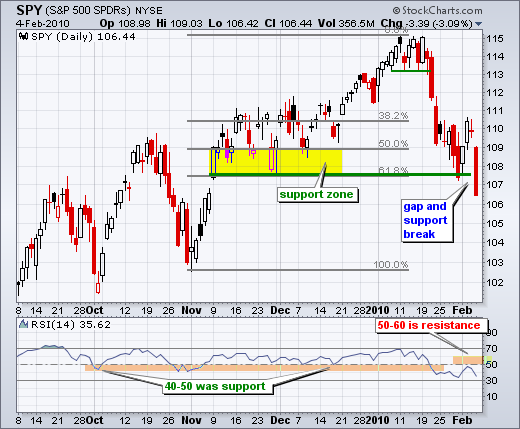
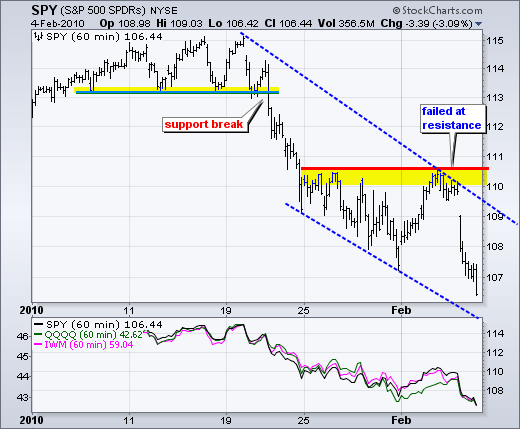
The S&P 500 ETF (SPY) failed at short-term resistance and broke medium-term support with a sharp decline on Thursday. A support zone around 108 held up for the prior six days, but wilted with a long red candlestick yesterday. Even though SPY remains above the last two reaction lows (early October and early November), this violent downside follow through looks like enough to reverse the medium-term uptrend. 14-day RSI is shown in the indicator window. Notice that the 40-50 zone acted as support during the uptrend. After breaking this zone in late January, the 50-60 zone is now acting as resistance. Look for this zone to continue as resistance as long as the medium-term downtrend extends. In other words, expect counter trend advances to fail soon after RSI enters the 50-60 zone.
Well, I thought the first resistance attempt would fail, but I did not expect such a big failure. SPY failed at resistance and plunged to a new reaction low. With a 3% decline yesterday, the ETF is already short-term oversold. While the ETF could certainly continue to the next medium-term support zone around 102-103, oversold conditions could make for choppy trading in the next few days.

About the author:
Arthur Hill, CMT, is the Chief Technical Strategist at TrendInvestorPro.com. Focusing predominantly on US equities and ETFs, his systematic approach of identifying trend, finding signals within the trend, and setting key price levels has made him an esteemed market technician. Arthur has written articles for numerous financial publications including Barrons and Stocks & Commodities Magazine. In addition to his Chartered Market Technician (CMT) designation, he holds an MBA from the Cass Business School at City University in London.
Learn More


