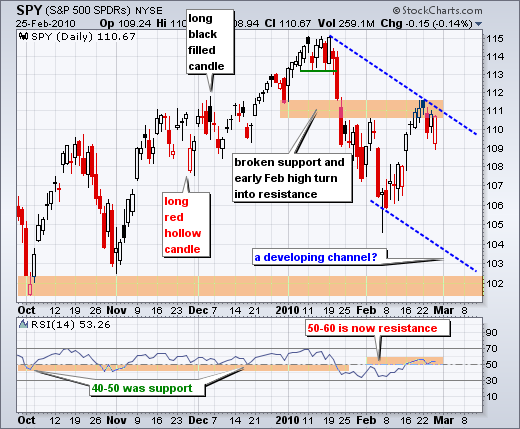
Before looking at the falling flag on the 60-minute chart, let's review some candlestick action on the daily chart. There is no change in the overall analysis as SPY appears to be developing a falling price channel. A break above 111.10 would throw cold water on this theory. I added a 10 cent buffer to 111. RSI is also meeting resistance in the 50-60 area. A break above 60 would be bullish for momentum. With a gap down and strong close, SPY formed a long hollow red candlestick. These are interesting candlesticks because they show a reversal off the lows and strong close. I would be especially impressed if this candlestick formed after an extended decline. So far, I am mildly impressed with yesterday's price action, but I would like to see follow through with a breakout at 111.10.

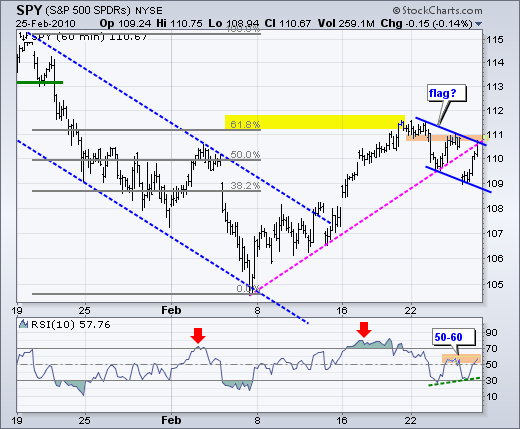
On the 60-minute chart, SPY has a falling flag working over the last few days. A move above 111.10 would break flag resistance and call for a continuation of the prior advance. The upside target would be the January highs around 115 and the flag low would turn into support. RSI is back in the 50-60 zone. A break above 60 would be short-term bullish for RSI.


On the 60-minute chart, SPY has a falling flag working over the last few days. A move above 111.10 would break flag resistance and call for a continuation of the prior advance. The upside target would be the January highs around 115 and the flag low would turn into support. RSI is back in the 50-60 zone. A break above 60 would be short-term bullish for RSI.


About the author:
Arthur Hill, CMT, is the Chief Technical Strategist at TrendInvestorPro.com. Focusing predominantly on US equities and ETFs, his systematic approach of identifying trend, finding signals within the trend, and setting key price levels has made him an esteemed market technician. Arthur has written articles for numerous financial publications including Barrons and Stocks & Commodities Magazine. In addition to his Chartered Market Technician (CMT) designation, he holds an MBA from the Cass Business School at City University in London.
Learn More


