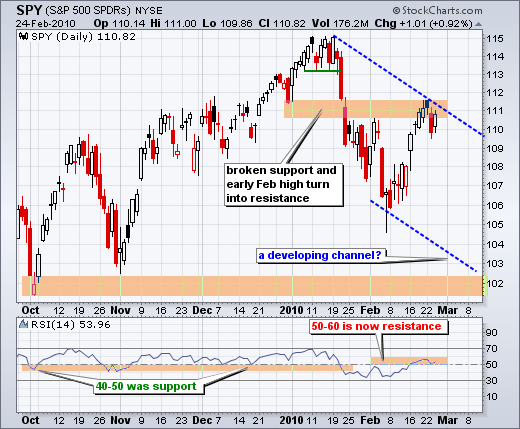
There is not much change on the daily chart. SPY hit resistance in the 111 area over the last few days. This resistance zone stems from broken support and the early February high. It also marks a 62% retracement of the January-February decline. Should a lower high form, I can then draw a falling price channel (blue dotted lines). This is still a developing pattern than could "undevelop" with a break above 111.5. As long as it remains possible, the downside target is around 102-103 for mid March. RSI is also meeting resistance in the 50-60 zone. The next signal would be a break below 50 in RSI and below 109.5 in SPY.

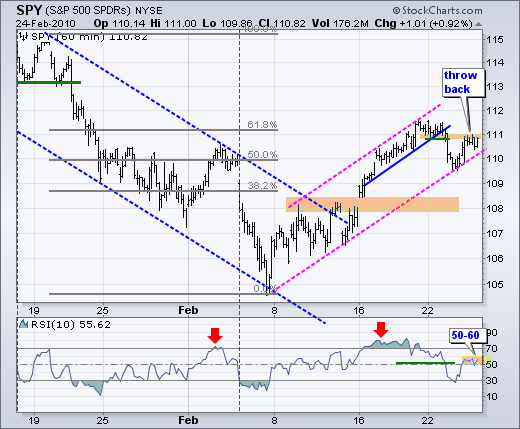
On the 60-minute chart, we got the throw-back bounce to the 110.8-111 area yesterday. This sometimes happens after a support break as the broken support area turns into resistance. I still expect a failure around 111 and a break below the channel trendline. RSI bounced back into the 50-60 zone, which may now act as resistance. A move back below 50 would put RSI back in bear mode.
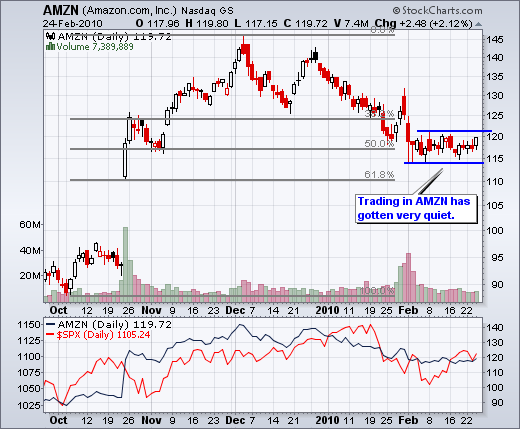
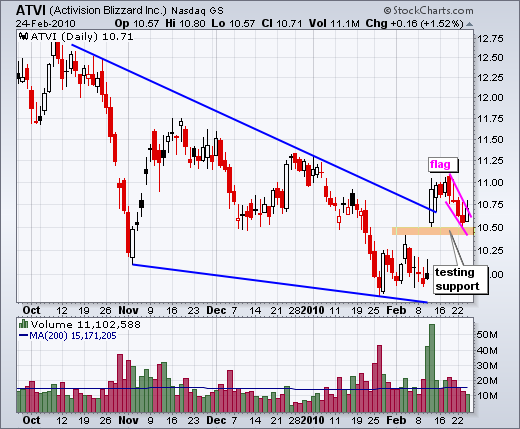
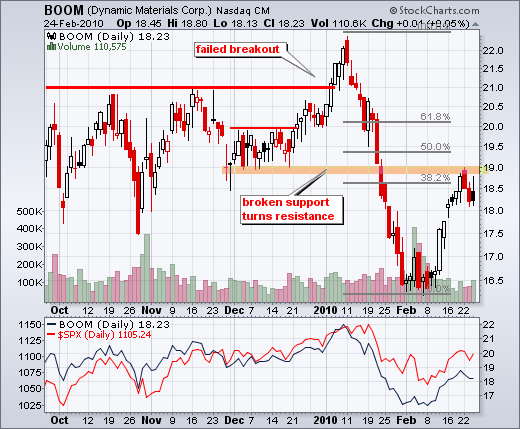
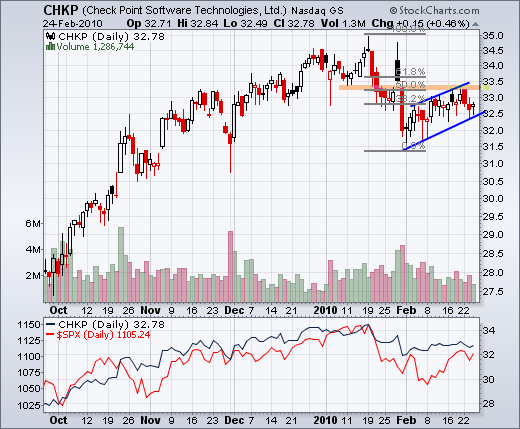
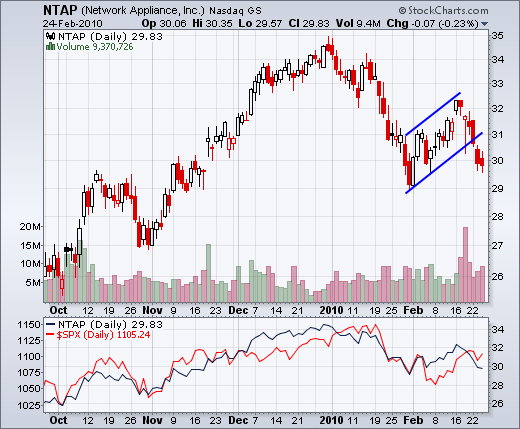
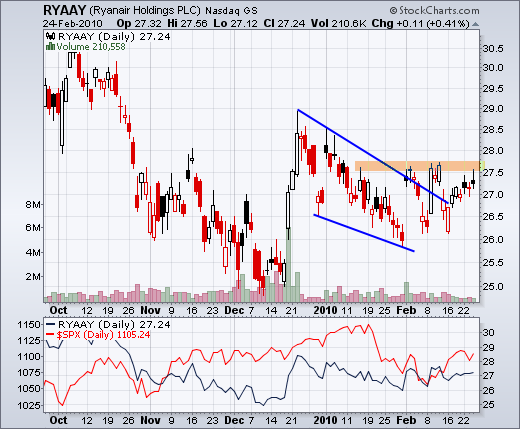
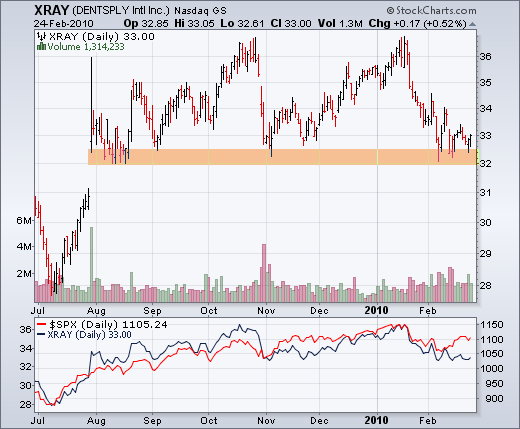
Charts of interest.

About the author:
Arthur Hill, CMT, is the Chief Technical Strategist at TrendInvestorPro.com. Focusing predominantly on US equities and ETFs, his systematic approach of identifying trend, finding signals within the trend, and setting key price levels has made him an esteemed market technician. Arthur has written articles for numerous financial publications including Barrons and Stocks & Commodities Magazine. In addition to his Chartered Market Technician (CMT) designation, he holds an MBA from the Cass Business School at City University in London.
Learn More


