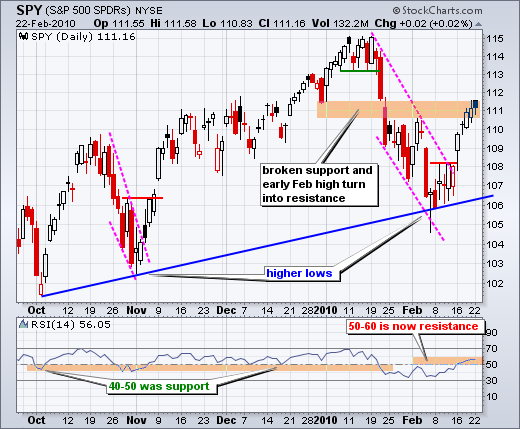
Even though the advance slowed over the last few days, the S&P 500 ETF (SPY) continues to hold its gains as buying pressure exceeds selling pressure. On the daily chart, SPY is up around 5% in the last two weeks and trading in a potential resistance zone around 111. I qualify this zone as potential because the gains are holding and we have yet to get confirmation with a decline. RSI is also trading in a potential resistance zone in the 50-60 area. Keep in mind that RSI 50-60 acts as a resistance zone in a medium-term DOWNTREND, which is the current assumption. While I think the prior decline (115 to 105) was enough to reverse the medium-term uptrend, I am always questioning my assumptions. In fact, it is possible that the uptrend remains in place and the plunge below 107 was an overshoot because of the quick move back above 108. Also, looking at the prior reaction lows, we have higher lows in early November and now in early February. SPY is essentially flat since mid November, but there could still be some upward drift at work here.
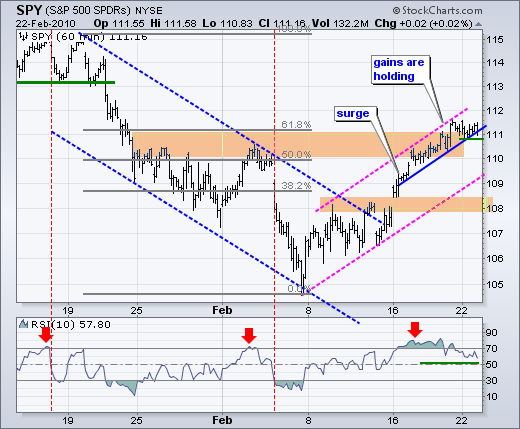
 Looking at the 60-minute chart, SPY surged above 110 and then worked its way higher the last few days. Even though upside momentum is slowing, the ability to continue higher after a surge shows sustained buying pressure. A smaller channel formed with support based on yesterday's lows. A break below Monday's low would be the first sign of weakness with a downside target around 108-109. RSI moved from overbought levels over the last two days, but remains above 50 to keep short-term momentum bullish.

 Looking at the 60-minute chart, SPY surged above 110 and then worked its way higher the last few days. Even though upside momentum is slowing, the ability to continue higher after a surge shows sustained buying pressure. A smaller channel formed with support based on yesterday's lows. A break below Monday's low would be the first sign of weakness with a downside target around 108-109. RSI moved from overbought levels over the last two days, but remains above 50 to keep short-term momentum bullish.


About the author:
Arthur Hill, CMT, is the Chief Technical Strategist at TrendInvestorPro.com. Focusing predominantly on US equities and ETFs, his systematic approach of identifying trend, finding signals within the trend, and setting key price levels has made him an esteemed market technician. Arthur has written articles for numerous financial publications including Barrons and Stocks & Commodities Magazine. In addition to his Chartered Market Technician (CMT) designation, he holds an MBA from the Cass Business School at City University in London.
Learn More


