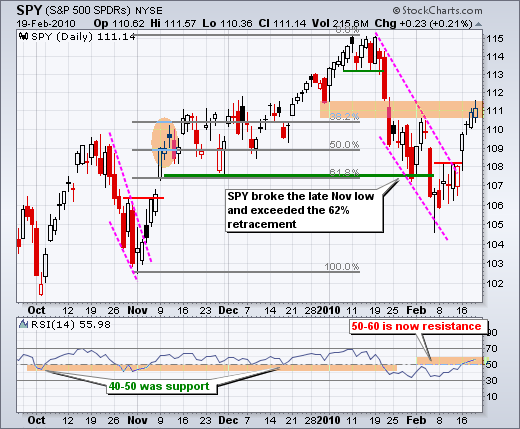
When marking support, resistance and reversal levels, zones are preferred to exact levels for two reasons. First, indices and ETFs are based on a basket of stocks. With more than one stock influencing price, we cannot expect support, resistance or reversal levels to be EXACT. Second, there are many buyers and sellers in the market. Believe it or not, not everybody uses technical analysis. Support, resistance and reversal zones are used to heighten alert levels. We need to be extra attentive to possible changes when a security enters one of these zones.
SPY is currently trading in one such zone - a resistance zone around 111. The ETF actually edged above 111 with some strength on Friday. Resistance around 111 stems from broken support and the early February high. In addition, RSI typically hits resistance around 50-60. Price resistance and momentum resistance are based on the assumptions that the medium-term trend is down and the advance over the last two weeks is an oversold bounce. This assumption could, of course, be wrong.

SPY is currently trading in one such zone - a resistance zone around 111. The ETF actually edged above 111 with some strength on Friday. Resistance around 111 stems from broken support and the early February high. In addition, RSI typically hits resistance around 50-60. Price resistance and momentum resistance are based on the assumptions that the medium-term trend is down and the advance over the last two weeks is an oversold bounce. This assumption could, of course, be wrong.

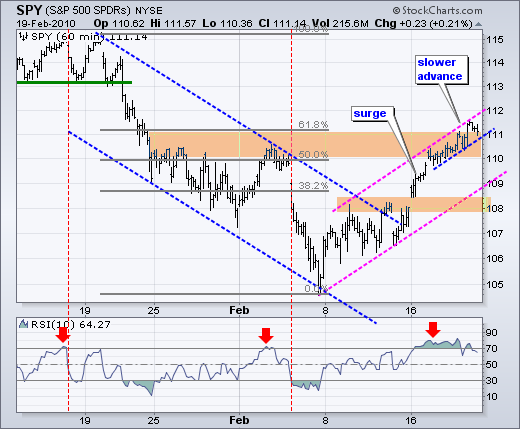
On the 60-minute chart, SPY continues to hug the upper trendline of the rising price channel. The ETF surged above 110 early in the week and then worked its way higher the last three days. Upside momentum is slowing, but there is clearly more upside momentum than downside momentum right now. RSI moved above 70 early last week and held above 70 until Friday. The dip below 70 is the first sign of waning momentum and a possible precursor to a short-term trend reversal. A break below 50 would turn short-term momentum bearish.


About the author:
Arthur Hill, CMT, is the Chief Technical Strategist at TrendInvestorPro.com. Focusing predominantly on US equities and ETFs, his systematic approach of identifying trend, finding signals within the trend, and setting key price levels has made him an esteemed market technician. Arthur has written articles for numerous financial publications including Barrons and Stocks & Commodities Magazine. In addition to his Chartered Market Technician (CMT) designation, he holds an MBA from the Cass Business School at City University in London.
Learn More


