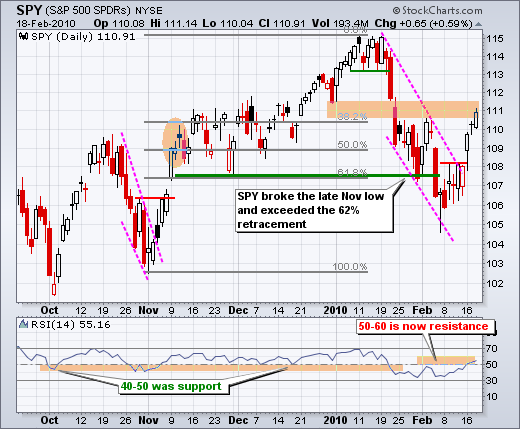
Even though SPY closed at its highest close of the month, I still think the ETF is in a resistance zone and this oversold bounce is getting long on tooth. In short, yesterday's advance does not change my overall view. SPY was oversold in early February and this is an oversold bounce. Resistance in the 111 area stems from broken support, the early February high and a 62% retracement of the Jan-Feb decline. In addition, RSI is in the downtrend resistance zone (50-60). If this is indeed just an oversold bounce, then I would expect it to end sooner rather than later. It all depends on my assumption that this is an oversold bounce, not a continuation of a bigger uptrend. There is always the chance that my assumption is, gasp, wrong.


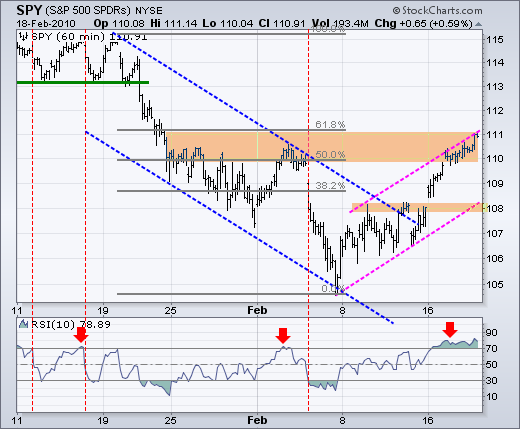
On the 60-minute chart, SPY edged further into the resistance zone. Even though the ETF exceeded the late January and early February highs, I would not call this a "breakout". A breakout implies further room to run. There may be further room to run, but I think the going will get a lot tougher from here on out. RSI moved above 70 early in the week and remains above 70. As noted yesterday, the first short-term signal would be a move back below 70. Further weakness below 50 would turn short-term momentum bearish.


About the author:
Arthur Hill, CMT, is the Chief Technical Strategist at TrendInvestorPro.com. Focusing predominantly on US equities and ETFs, his systematic approach of identifying trend, finding signals within the trend, and setting key price levels has made him an esteemed market technician. Arthur has written articles for numerous financial publications including Barrons and Stocks & Commodities Magazine. In addition to his Chartered Market Technician (CMT) designation, he holds an MBA from the Cass Business School at City University in London.
Learn More


