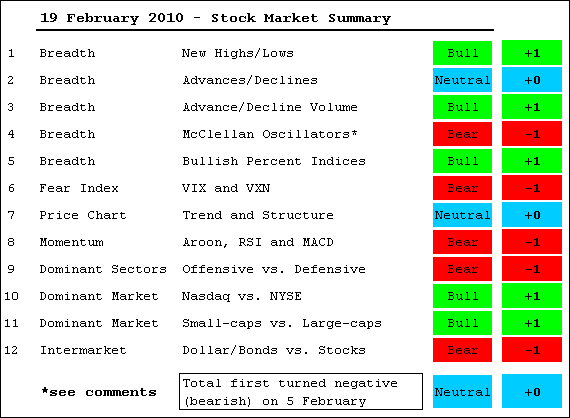
Transition periods are tricky. The bulk of the evidence shifted towards the bears on February 5th, but the Market Summary Table shifted to +2 this week, which slightly favors the bulls. Three items are responsible for this shift. The McClellan Oscillators both moved above +50. The Nasdaq is outperforming the NY Composite this year. Small-caps are outperforming large-caps in 2010. It is either the start of a bull run, like July and October, or this will result in a whipsaw. This is the point where intuition and sixth sense come into play. Looking at the three responsible indicators, I am inclined to reverse my position in the McClellan Oscillators because they are prone to whipsaws. First, the two week market surge could be just an oversold bounce. Second, the last few McClellan Oscillator surges above +50 did not last long. Therefore, I will make an executive decision to call the McClellan Oscillators bearish, which changes their score from +1 to -1. This moves the Market Summary Total from +2 to 0 (neutral). Indicators are detailed after the jump.


- AD Lines: Neutral. The Nasdaq AD Line is trending down with lower lows in January-February. The NYSE AD Line remains in an uptrend overall.
- AD Volume Lines: Bullish. The Nasdaq and NYSE AD Volume Lines are still in uptrends.
- Net New Highs: Bullish. Nasdaq Net New Highs are positive (+100), but half the level seen in early January (+200). NYSE Net New Highs are also positive (+160), but well below the highs seen in early January (+400 to +480).
- McClellan Oscillators: Bearish. The Nasdaq and NYSE McClellan Oscillators surged above +50 this week. Technically, this up thrust in breadth is bullish, but I am not sure it will hold. Prior surges in mid September and late December were soon reversed so I will stay bearish for the moment.
- Updated breadth charts can be seen here.
- Bullish Percent Indices: Bullish. Although a lagging/coincident indicator, all major index BPI's are above 50%. All sector BPI's are also above 50%.
- Fear Index: Bearish. After breaking their late November highs, the VIX and VXN pulled back sharply as the market bounced the last two weeks. The moment-of-truth is near.
- Trend Structure: Neutral. SPY and DIA broke their late November lows, but QQQQ, IWM and RSP held corresponding lows and their 62% retracements.
- SPY Momentum: Bearish. The Aroon Oscillator broke -50, MACD (5,35,5) turned negative and 14-day RSI broke uptrend support zone (40-50) in January.
- Offensive Sector Performance: Bearish. The Financials SPDR (XLF) and Technology SPDR (XLK) continue showing relative weakness, while the Consumer Staples SPDR (XLP) hit a new 52-week high on Thursday.
- Nasdaq Performance: Bullish. The Nasdaq led the NY Composite over the last two weeks.
- Small-caps Performance: Bullish. Small-caps led large-caps over the last two weeks.
- Intermarket: Bearish. Dollar is rising as investors turn risk averse

About the author:
Arthur Hill, CMT, is the Chief Technical Strategist at TrendInvestorPro.com. Focusing predominantly on US equities and ETFs, his systematic approach of identifying trend, finding signals within the trend, and setting key price levels has made him an esteemed market technician. Arthur has written articles for numerous financial publications including Barrons and Stocks & Commodities Magazine. In addition to his Chartered Market Technician (CMT) designation, he holds an MBA from the Cass Business School at City University in London.
Learn More


