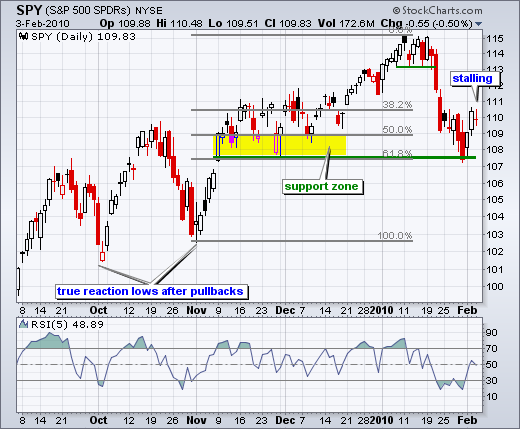
SPY surged off support with two good gains on Monday-Tuesday, but ran into short-term resistance on Wednesday and stalled with a doji. The doji looks like a big plus sign (+). With little change from open to close, the horizontal portion is small or just a line. Vertical lines represent the intraday high-low. Despite movement within the day, prices ended up right where they started. SPY is having second thoughts ahead of Friday's employment report.


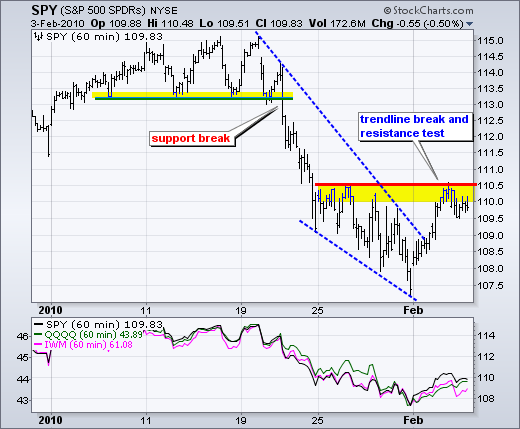
On the 60-minute chart, SPY raced to resistance on Tuesday and hit the wall on Wednesday. This Monday-Tuesday advance is the sharpest two day advance of 2010. But will it hold? A breakout here would open the door to the 112-113 area. Failure would lead to a test of last week's lows and perhaps even a support break. There is also the possibility that SPY moves into a choppy trading range, such as the mid November to mid December period.


About the author:
Arthur Hill, CMT, is the Chief Technical Strategist at TrendInvestorPro.com. Focusing predominantly on US equities and ETFs, his systematic approach of identifying trend, finding signals within the trend, and setting key price levels has made him an esteemed market technician. Arthur has written articles for numerous financial publications including Barrons and Stocks & Commodities Magazine. In addition to his Chartered Market Technician (CMT) designation, he holds an MBA from the Cass Business School at City University in London.
Learn More


