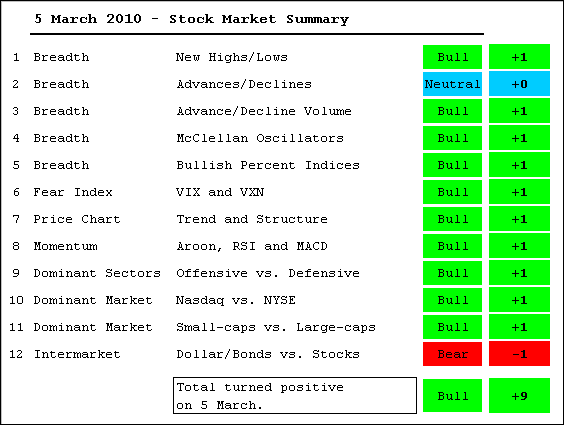
With further strength this week, the market summary table moved from -2 to +9. The only negative indications come from the Nasdaq AD Line and strength in the Dollar. In addition, relative weakness in the large-cap indices (SPY and DIA) is a concern. The rally over the last four weeks exceeded expectations as momentum oscillators turned bullish again, the Russell 2000 ETF broke its January high and Net New Highs surged early in the week. Also notice that the NYSE AD Line and Nasdaq AD Volume Line hit new 52-week highs. Keep in mind that this table is not designed to predict turning points. Instead, it is designed to weigh the evidence (bullish versus bearish) and establish a bias. It is not for market timing and it is certainly not immune to whipsaws. Indicator details can be found after the "continue reading" jump.
- AD Lines: Neutral. The Nasdaq AD Line is nearing its January high, but still remains in a downtrend. The NYSE AD Line hit a new 52-week high this week and remains in a clear uptrend.
- AD Volume Lines: Bullish. The AD Volume Lines remain in uptrends overall. The Nasdaq AD Volume Line broke above its January high to record a new 52-week high. The NYSE AD Volume Line is still trending up, but remains below its January high.
- Net New Highs: Bullish. Nasdaq and NYSE Net New Highs surged to their highest levels since January and the Cumulative Net New Highs lines remain above their 10-day SMAs (rising).
- McClellan Oscillators: Bullish. The Nasdaq and NYSE McClellan Oscillators surged above +50 for the second time in three weeks.
- Bullish Percent Indices: Bullish. Although a lagging/coincident indicator, all major index BPI's are above 50%. All sector BPI's are also above 50%. The Finance sector Bullish Percent Index is the weakest at +54%.
- Fear Index: Bullish. The S&P 500 Volatility Index ($VIX) and Nasdaq 100 Volatility Index ($VXN) fell further this week, but remain above their January lows. Barring a higher low and break above their late February high, the trend in these fear indices is down and that is positive for stocks.
- Trend Structure: Neutral. The Russell 2000 ETF (IWM) and S&P 400 MidCap ETF (MDY) both broke their January highs, which is bullish. However, the Dow SPDR (DIA), S&P 500 ETF (SPY) and Nasdaq 100 ETF (QQQQ) have yet to confirm.
- SPY Momentum: Bullish. The Aroon Oscillator surged above +50, MACD is back in positive territory and RSI broke above 60. It may be a whipsaw, but the momentum indicators have recovered enough to turn bullish again.
- Offensive Sector Performance: Bullish. The Consumer Discretionary SPDR (XLY) broke its January high and the Industrials SPDR (XLI) is challenging its January high. The Financials SPDR (XLF) also rebounded with a good move off support the last few weeks. Even though the Technology SPDR (XLK) is lagging, three of the four are looking positive.
- Nasdaq Performance: Bullish. The Nasdaq led the NY Composite over the last four weeks.
- Small-caps Performance: Bullish. Small-caps and mid-caps outperformed large-caps over the last three weeks.
- Intermarket: Bearish. Dollar is rising as investors turn risk averse.

About the author:
Arthur Hill, CMT, is the Chief Technical Strategist at TrendInvestorPro.com. Focusing predominantly on US equities and ETFs, his systematic approach of identifying trend, finding signals within the trend, and setting key price levels has made him an esteemed market technician. Arthur has written articles for numerous financial publications including Barrons and Stocks & Commodities Magazine. In addition to his Chartered Market Technician (CMT) designation, he holds an MBA from the Cass Business School at City University in London.
Learn More


