Art's Charts

SPY becomes short-term overbought

Arthur Hill

Arthur Hill

Chief Technical Strategist, TrendInvestorPro.com

Stocks surged with a better-than-expected employment report on Friday. The Russell 2000, S&P 500 Equal-Weight Index, Nasdaq 100 Equal-weight Index and S&P 400 MidCap Index all recorded new 52-week highs. The Nasdaq 100, Dow and S&P 500 also surged, but remain just below their January highs. Small-caps are clearly leading the way higher here. Large-caps are lagging. Think of this as a Dow Theory style non-confirmation. Ideally, all of the major indices would record new 52-week highs within a week or two of each other. With the large-cap indices still below their January highs, I will be watching for confirmation in the coming days. Continued non-confirmation from the large-caps indices would be negative.

While small-cap leadership is generally bullish and shows an increase in risk appetite, it also reflects an increase in bullish sentiment. This is confirmed by Mark Hulbert of CBSMarketWatch.com:

Based on the several hundred investment advisers I track, I'd have to say that bullish sentiment is approaching dangerously high levels. Consider the Hulbert Stock Newsletter Sentiment Index (HSNSI), which represents the average recommended stock market exposure among a subset of short term stock market timers tracked by the Hulbert Financial Digest. It currently stands at 62.8%, up from 13.8% just one month ago. That's an awfully big jump for so short a period of time, especially considering that the Dow Jones Industrial Average rose a modest 4.4% over this period. Also worrying is that, with but one exception, the HSNSI is now at its highest level since early 2007, more than three years ago. That one exception, when the HSNSI was higher than it is now, came in early January, two months ago. Soon thereafter, of course, the market entered into its January-February correction, during which the Dow declined by nearly 8%.
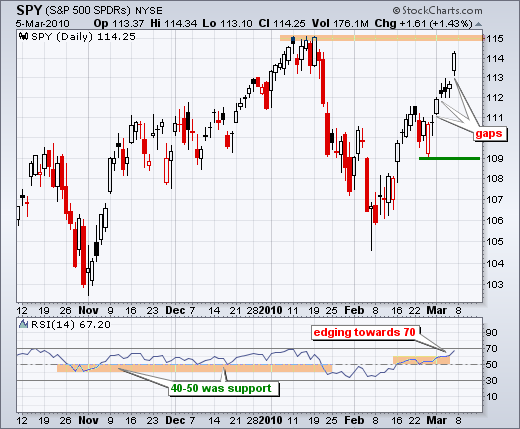
Sentiment indicators are hard to use for timing. Excessive bullishness warns that the stock market may be getting too frothy, but we need to use the charts for actual signals. Last week, SPY gapped up three times: Monday, Tuesday, Friday. All three gaps held, which is impressive. The ability to hold these gaps shows strength, not weakness. Look for a move below 112 to fill the last two gaps. Key support remains at 109 for now.

100309spyi

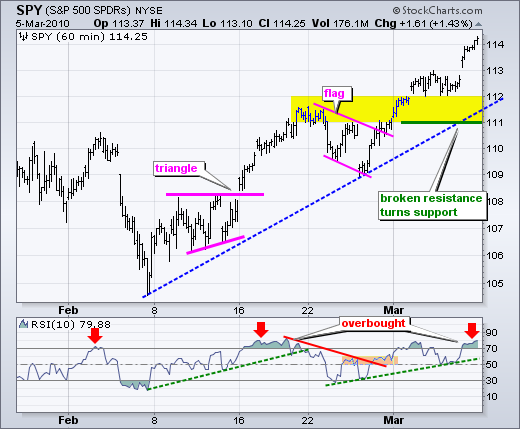
On the 60-minute chart, SPY broke flag resistance on Friday, February 26th, and never looked back. This was the second consolidation breakout of the month. After a run from 109 to 114 (~4.5%) in seven trading days, the ETF is clearly overbought and ripe for a pullback or consolidation. Broken flag resistance and last week's consolidation lows mark a support zone around 111-112. This zone is confirmed by the trendline extending up from the February lows. Also notice that RSI is overbought as it trades above 70 for the second time this month. A move below 50 would turn short-term momentum bearish and a break below 111 would reverse the short-term uptrend.

100309spyd
 
Potential market moving reports this week:
Wed: Mar 10 - 10:30 - Crude Inventories
Thu: Mar 11 - 08:30 - Initial Claims    
Fri: Mar 12 - 08:30 - Retail Sales        
Fri: Mar 12 - 09:55 - Michigan Sentiment      

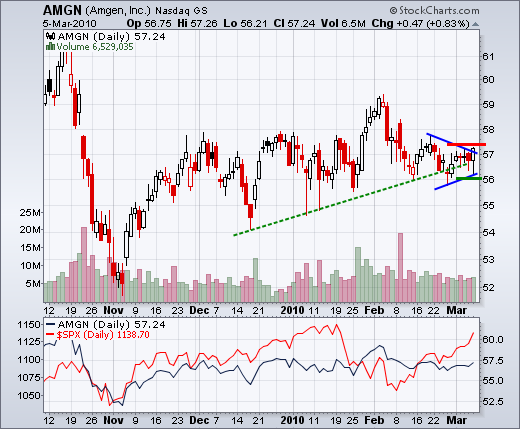
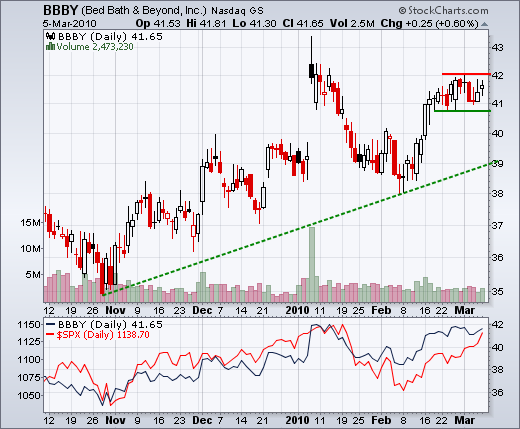
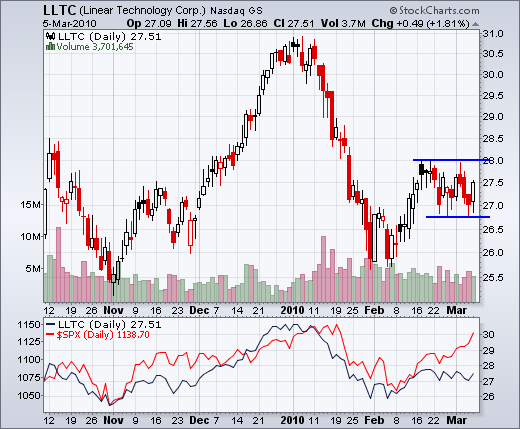
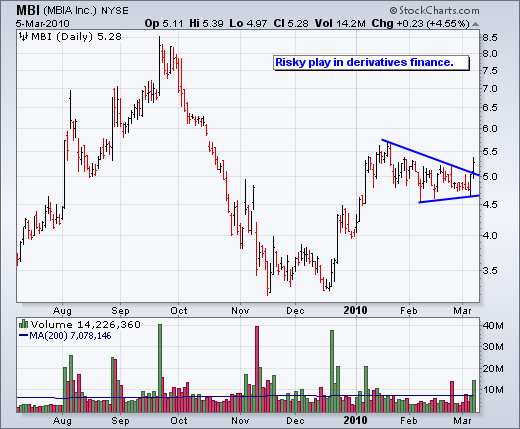
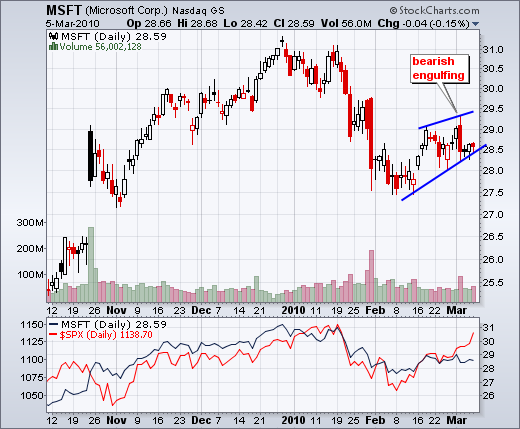
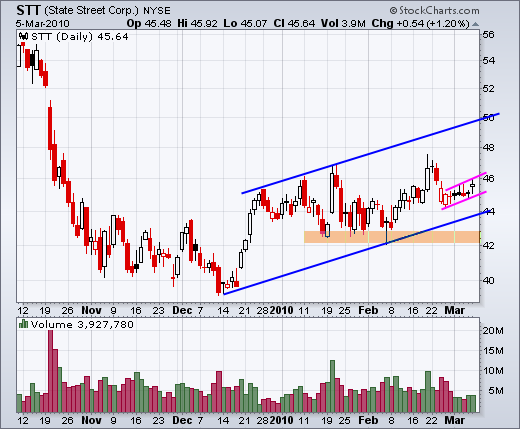
Charts of Interest: ADBE, AMGN, BBBY, LLTC, MBI, MSFT, STT
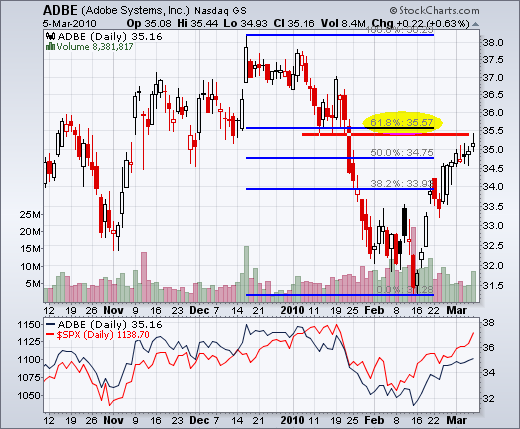
100309adbe
100309amgn
100309bbby
100309lltc
100309mbi
100309msft
100308stt
Arthur Hill
About the author: , CMT, is the Chief Technical Strategist at TrendInvestorPro.com. Focusing predominantly on US equities and ETFs, his systematic approach of identifying trend, finding signals within the trend, and setting key price levels has made him an esteemed market technician. Arthur has written articles for numerous financial publications including Barrons and Stocks & Commodities Magazine. In addition to his Chartered Market Technician (CMT) designation, he holds an MBA from the Cass Business School at City University in London. Learn More