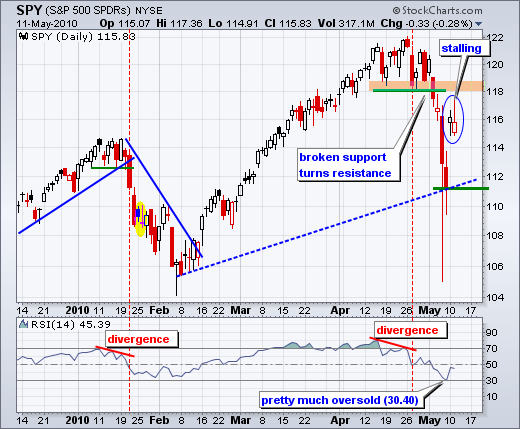
Despite the big bailout package from the EU over the weekend, the Euro moved lower on Tuesday as Forex traders renewed selling pressure. Gold surged as a substitute for fiat currencies. Once again we have both the Dollar and gold moving higher. I consider this negative for stocks and continued strength in both should be monitored. We can also add weakness in China. On the daily chart, the S&P 500 ETF (SPY) is stalling around 116 with some indecisive price action the last two days. The gain to around 116 occurred with one big gap. Prices have been trading flat since this opening gap. As noted yesterday, I would not be surprised to see some backing and filling as the market digest the recent gains and bailout ramifications. Broken support around 118 turns into resistance on the daily chart, but we are seeing resistance a little lower on the intraday chart.

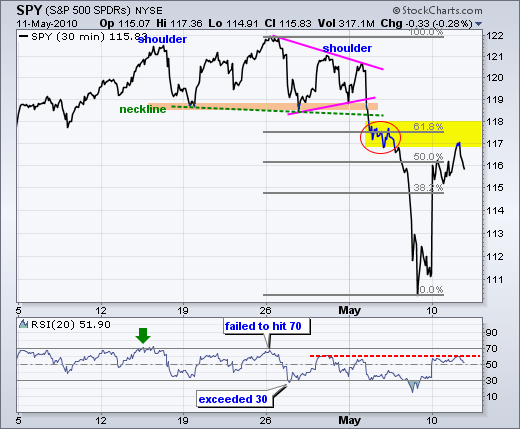
On the 30-minute chart, I am showing closing prices to filter out the big spike on Thursday. Based on these prices, a 50-62% retracement of the prior decline would extend to the 116-118 area. There is also some resistance possible from the small consolidation last week (red circle). RSI is trading at a potential resistance area in the 50-60 zone. This area marked resistance in late April and early May. All in all, this rally is reaching its moment-of-truth. A move below Monday's reaction low (115) would argue for the start of a pullback that could retest last week's low around 111-113.
Key Economic reports:
Wed - May 12 - 10:30AM - Crude Inventories
Thu - May 13 - 08:30AM - Initial Claims
Fri - May 14 - 08:30AM - Retail Sales
Fri - May 14 - 09:15AM - Industrial Production
Fri - May 14 - 09:55AM - Mich Sentiment
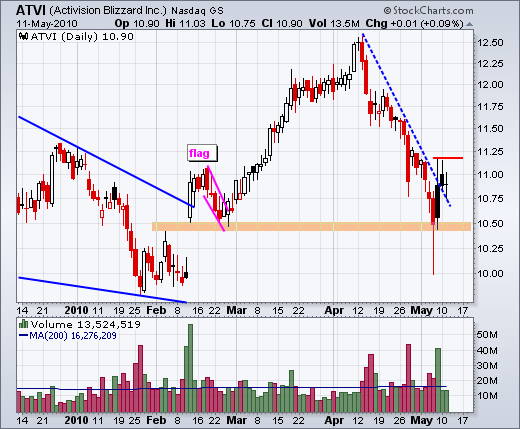
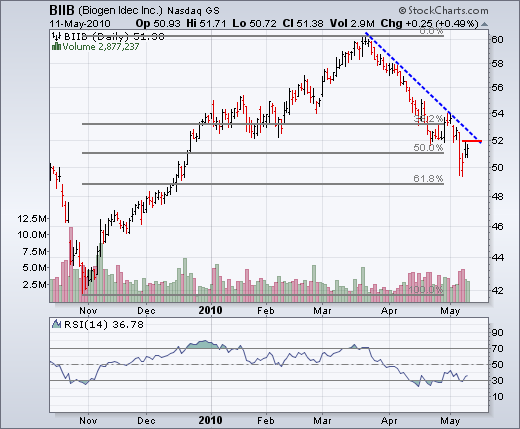
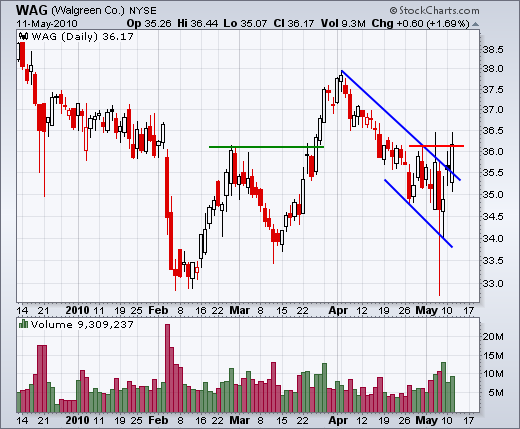
Charts of Interest: ATVI, BIIB, HRB, LUB, KO, RIMM, WAG
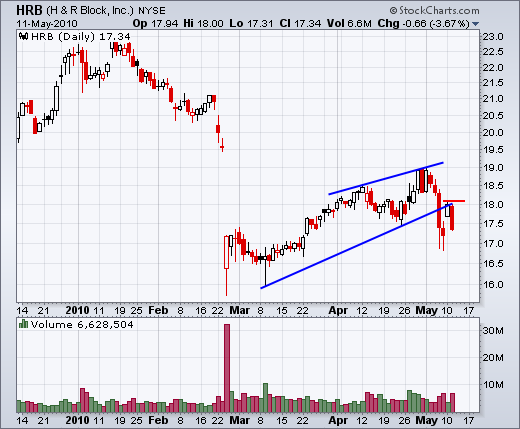
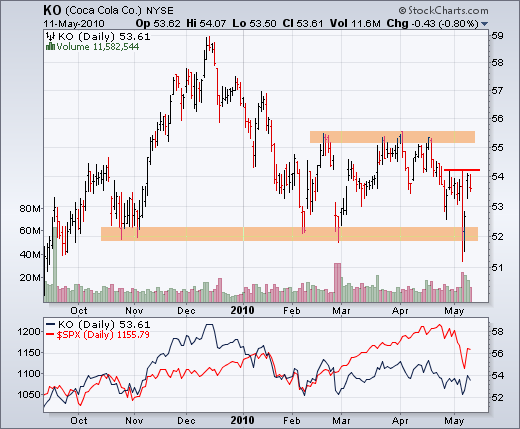
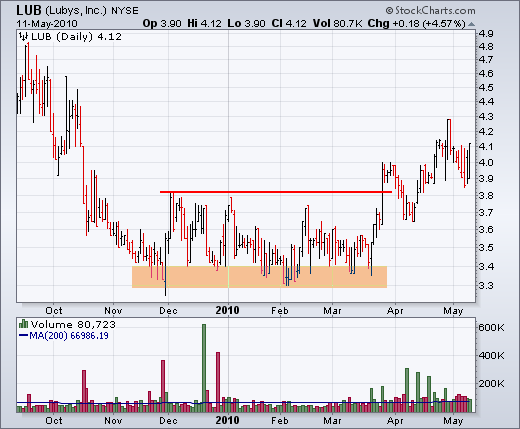
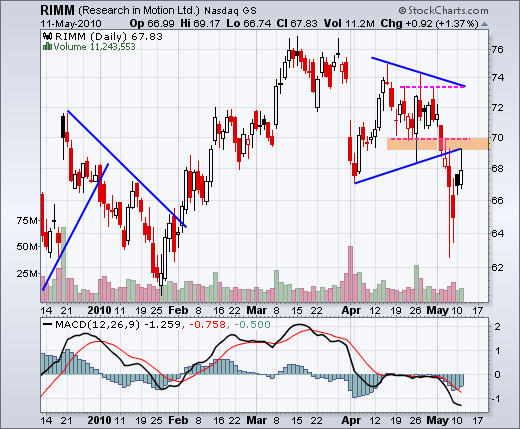
This commentary and charts-of-interest are designed to stimulate thinking. This analysis is not a recommendation to buy, sell, hold or sell short any security (stock ETF or otherwise). We all need to think for ourselves when it comes to trading our own accounts. First, it is the only way to really learn. Second, we are the only ones responsible for our decisions. Think of these charts as food for further analysis. Before making a trade, it is important to have a plan. Plan the trade and trade the plan. Among other things, this includes setting a trigger level, a target area and a stop-loss level. It is also important to plan for three possible price movements: advance, decline or sideways. Have a plan for all three scenarios BEFORE making the trade. Consider possible holding times. And finally, look at overall market conditions and sector/industry performance.

Key Economic reports:
Wed - May 12 - 10:30AM - Crude Inventories
Thu - May 13 - 08:30AM - Initial Claims
Fri - May 14 - 08:30AM - Retail Sales
Fri - May 14 - 09:15AM - Industrial Production
Fri - May 14 - 09:55AM - Mich Sentiment
Charts of Interest: ATVI, BIIB, HRB, LUB, KO, RIMM, WAG


This commentary and charts-of-interest are designed to stimulate thinking. This analysis is not a recommendation to buy, sell, hold or sell short any security (stock ETF or otherwise). We all need to think for ourselves when it comes to trading our own accounts. First, it is the only way to really learn. Second, we are the only ones responsible for our decisions. Think of these charts as food for further analysis. Before making a trade, it is important to have a plan. Plan the trade and trade the plan. Among other things, this includes setting a trigger level, a target area and a stop-loss level. It is also important to plan for three possible price movements: advance, decline or sideways. Have a plan for all three scenarios BEFORE making the trade. Consider possible holding times. And finally, look at overall market conditions and sector/industry performance.

About the author:
Arthur Hill, CMT, is the Chief Technical Strategist at TrendInvestorPro.com. Focusing predominantly on US equities and ETFs, his systematic approach of identifying trend, finding signals within the trend, and setting key price levels has made him an esteemed market technician. Arthur has written articles for numerous financial publications including Barrons and Stocks & Commodities Magazine. In addition to his Chartered Market Technician (CMT) designation, he holds an MBA from the Cass Business School at City University in London.
Learn More


