Art's Charts

A monster gap to retracement

Arthur Hill

Arthur Hill

Chief Technical Strategist, TrendInvestorPro.com

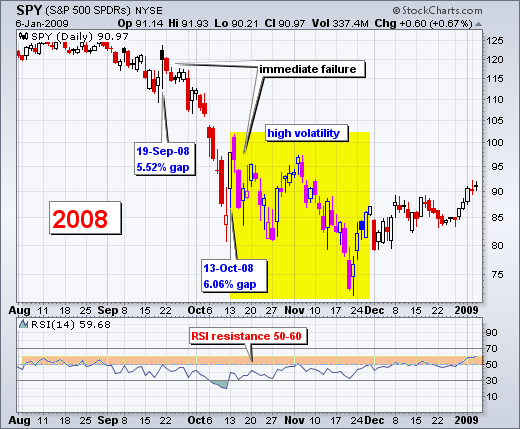
As expected, the S&P 500 ETF (SPY) gapped above 115 on the open with a 4.08% opening surge. This is the third biggest opening gap (up) in years, perhaps ever. SPY gapped up 5.52% on 19-Sep-08 and 6.06% on 13-Oct-08. Guess what? These gaps did not mark major lows. The first gap was a serious head-fake as SPY continued lower the next day and fell over 40% from 20-Sept to 10-Oct. The second gap on 13-Oct produced a one-day rally as well and SPY moved into an extremely volatile period the next six weeks. It should be noted that these gaps occurred during a bigger downtrend. SPY peaked in October 2007 and broke major support in January 2008. In addition, the financial crisis at the time was centered in the US. This time is a little different because the financial crisis is centered in Europe and the bigger trend remains up in the US. The bigger trend remains down in Europe though (FEZ). As noted in yesterday's market message, it could be early October 2008 in Europe. It remains to be seen whether or not Europe drags down the US too.

100511spy2008

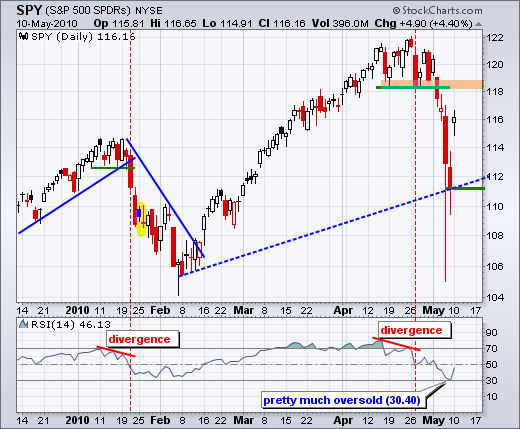
On the daily chart, SPY opened strong and closed strong. The ability to hold early gains is a plus. At this point, Monday's gap and Friday's close become key areas to watch. A successful, and strong gap, should hold. Failure to hold would show underlying weakness. SPY is also a little short-term overextended after a 4.4% surge in one day. We may see some backing and filling over the next few days.

100511spyd
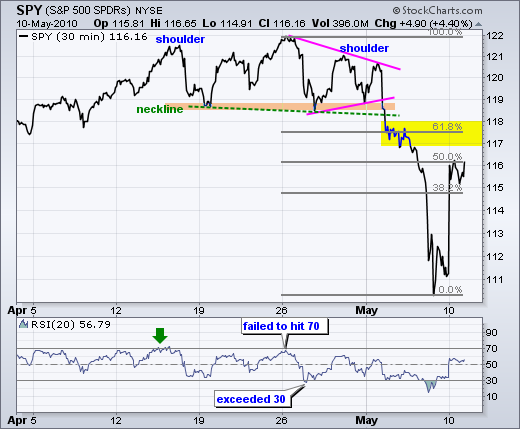
On the 30-minute chart, SPY retraced 50% of the prior decline with a surge to 116. SPY opened above 115 and held above 115 throughout the day. While impressive, I think resistance is closer than support at this stage. Support is around 111 from last week's lows. Resistance is around 118 from the 62% retracement and broken support. We could see some choppy trading as the markets digest recent gains and bailout news.
100511spyi

Key Economic reports:   

Wed - May 12 - 10:30AM - Crude Inventories   
Thu - May 13 - 08:30AM - Initial Claims
Fri - May 14 - 08:30AM - Retail Sales        
Fri - May 14 - 09:15AM - Industrial Production
Fri - May 14 - 09:55AM - Mich Sentiment

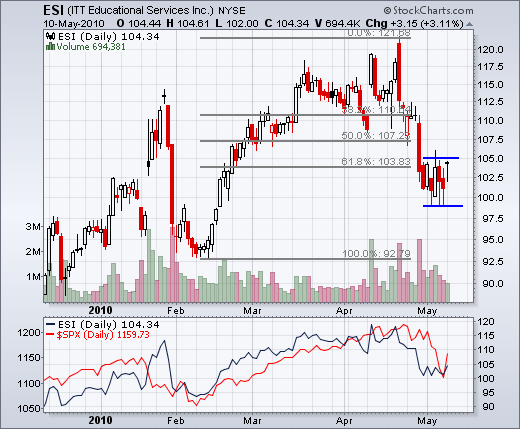
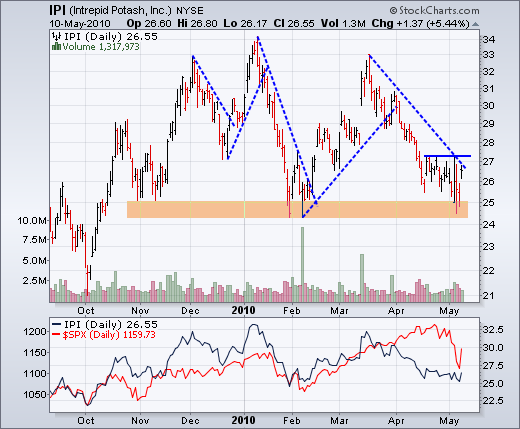
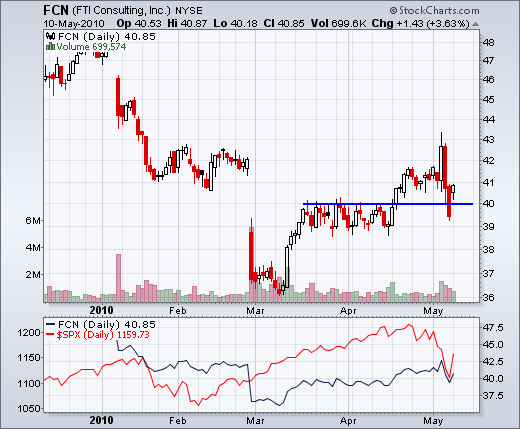
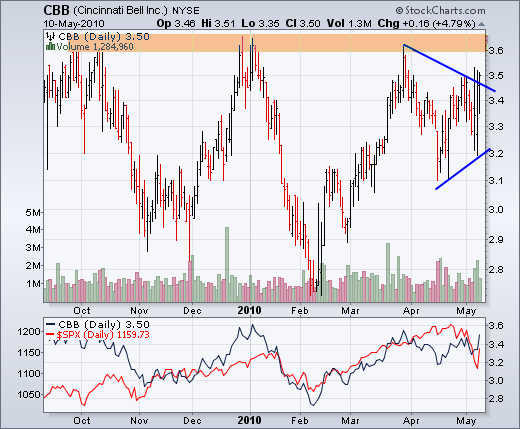
Charts of Interest: CBB, ESI, FCN, IPI.
100511cbb

100511fcn
100511itt
100511ipi

This commentary and charts-of-interest are designed to stimulate thinking. This analysis is not a recommendation to buy, sell, hold or sell short any security (stock ETF or otherwise). We all need to think for ourselves when it comes to trading our own accounts. First, it is the only way to really learn. Second, we are the only ones responsible for our decisions. Think of these charts as food for further analysis. Before making a trade, it is important to have a plan. Plan the trade and trade the plan. Among other things, this includes setting a trigger level, a target area and a stop-loss level. It is also important to plan for three possible price movements: advance, decline or sideways. Have a plan for all three scenarios BEFORE making the trade. Consider possible holding times. And finally, look at overall market conditions and sector/industry performance.

Arthur Hill
About the author: , CMT, is the Chief Technical Strategist at TrendInvestorPro.com. Focusing predominantly on US equities and ETFs, his systematic approach of identifying trend, finding signals within the trend, and setting key price levels has made him an esteemed market technician. Arthur has written articles for numerous financial publications including Barrons and Stocks & Commodities Magazine. In addition to his Chartered Market Technician (CMT) designation, he holds an MBA from the Cass Business School at City University in London. Learn More