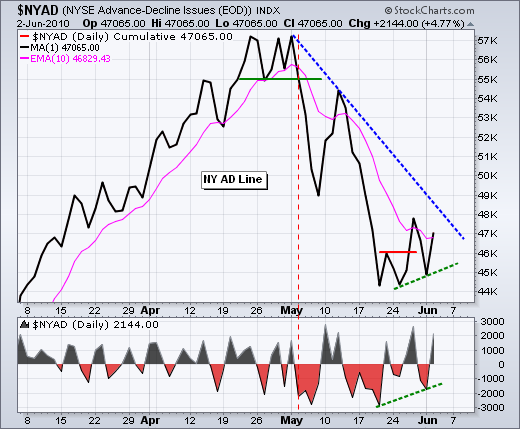
After declining on Friday and Tuesday, stocks rallied throughout the day on Wednesday. This is especially impressive when we consider that European stocks were down sharply and the Euro was getting hit on Wednesday morning. Stocks managed to shrug off bad geopolitical news and rally. There was even a dip in the afternoon, but buyers stepped right in and pushed the indices to their highest levels by the close. Small-caps led the way with the Russell 2000 gaining 3.05%. Eight of the nine sectors gained over 2%. Energy and materials led with big oversold bounces, but technology, consumer discretionary and finance also put in strong performances. Breadth was strong on both the Nasdaq and NYSE, but volume was light. Players may be holding back ahead of Friday's employment report. The chart below shows the AD Line for the NYSE. After a breakout in late May, the AD Line formed a higher low this week and surged above its 10-day EMA. Also notice that Net Advances formed a higher low from mid May to early June. Selling pressure is diminishing and this key breadth stat is trying to start an uptrend.
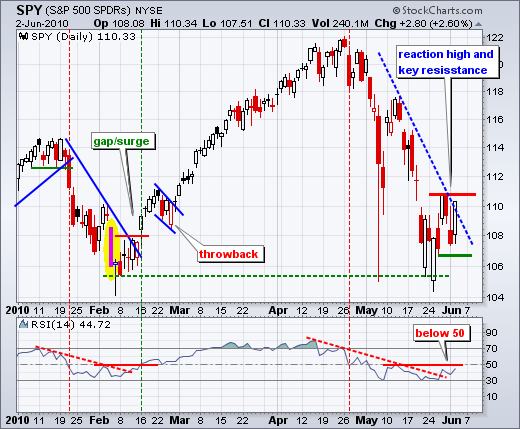
On the daily chart, SPY held above support and recouped Tuesday's loss with a surge above 110. The February low is getting one heck of a test with the fourth long white candlestick or big gain in the last two weeks. Right now, this test is succeeding. Follow through above 110 with good breadth and volume would officially reverse the six week downtrend. Key support is set at 107 for now. Failure to hold yesterday's gains and a break below this level would be most bearish. RSI is edging towards 50 and a break above this level would turn momentum bullish.
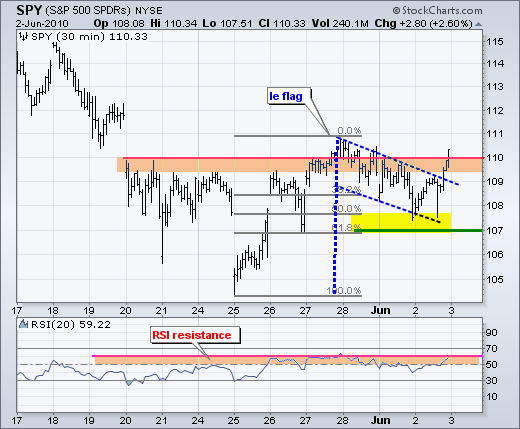
On the 30-minute chart, SPY found support near the 50-62% retracement zone and surged above 110 with a strong close. The decline over the last three days looks like a falling flag. The breakout signals a continuation of the late May advance and targets further strength towards the 113.50 area. Flags fly at half mast and the first part of the pole extends from 105 to 111 (6 points). A 6 point advance from the flag low (107.5) would target a gain to around 113.5. Failure to hold the breakout around 109 would be negative. A break below 107 would totally negate this bullish sequence.
Key Economic Reports:
Thu - Jun 03 - 08:15 - ADP Employment Report
Thu - Jun 03 - 08:30 - Initial Claims
Thu - Jun 03 - 10:00 - Factory Orders
Fri - Jun 03 - 10:00 - ISM Services
Fri - Jun 04 - 08:30 - Employment Report
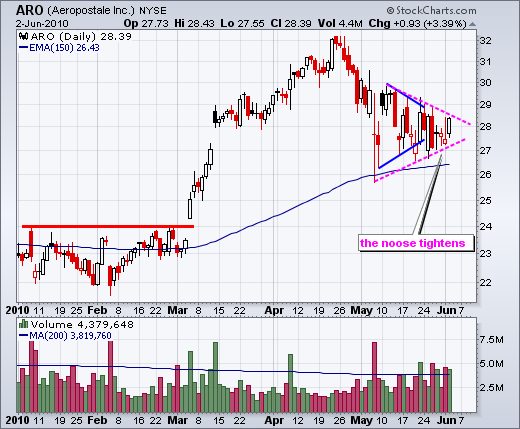
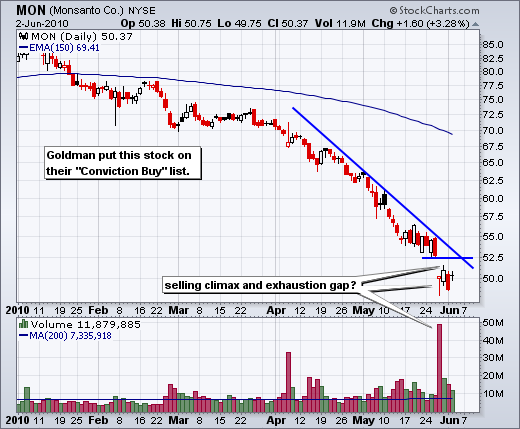
Charts of Interest: ARO, BA, DD, DELL, GPS, MON,
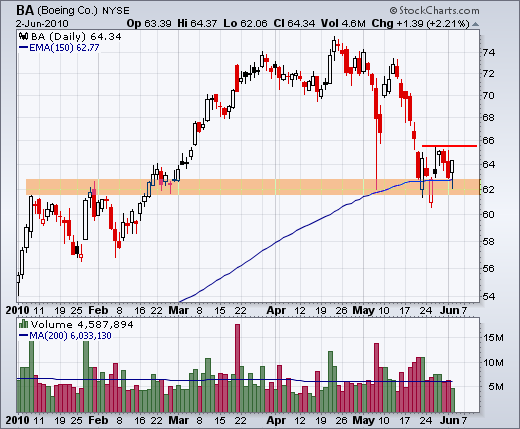
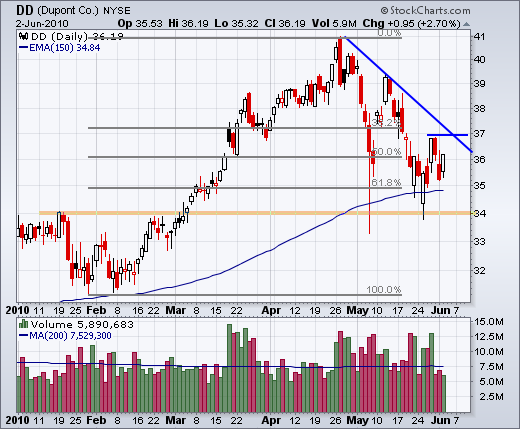
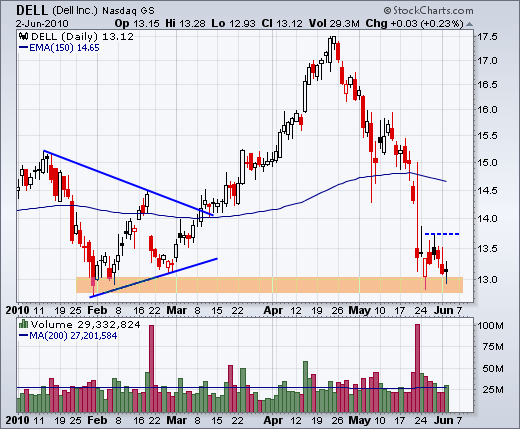
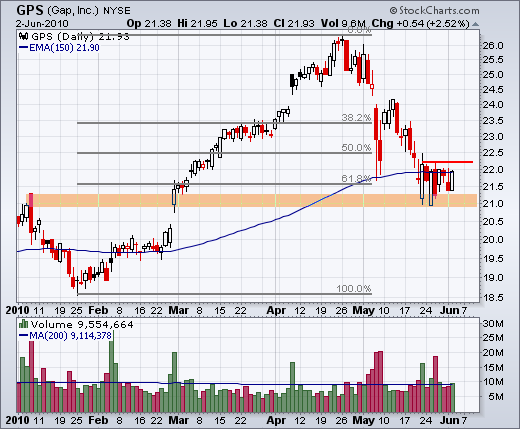
This commentary and charts-of-interest are designed to stimulate thinking. This analysis is not a recommendation to buy, sell, hold or sell short any security (stock ETF or otherwise). We all need to think for ourselves when it comes to trading our own accounts. First, it is the only way to really learn. Second, we are the only ones responsible for our decisions. Think of these charts as food for further analysis. Before making a trade, it is important to have a plan. Plan the trade and trade the plan. Among other things, this includes setting a trigger level, a target area and a stop-loss level. It is also important to plan for three possible price movements: advance, decline or sideways. Have a plan for all three scenarios BEFORE making the trade. Consider possible holding times. And finally, look at overall market conditions and sector/industry performance.

About the author:
Arthur Hill, CMT, is the Chief Technical Strategist at TrendInvestorPro.com. Focusing predominantly on US equities and ETFs, his systematic approach of identifying trend, finding signals within the trend, and setting key price levels has made him an esteemed market technician. Arthur has written articles for numerous financial publications including Barrons and Stocks & Commodities Magazine. In addition to his Chartered Market Technician (CMT) designation, he holds an MBA from the Cass Business School at City University in London.
Learn More
