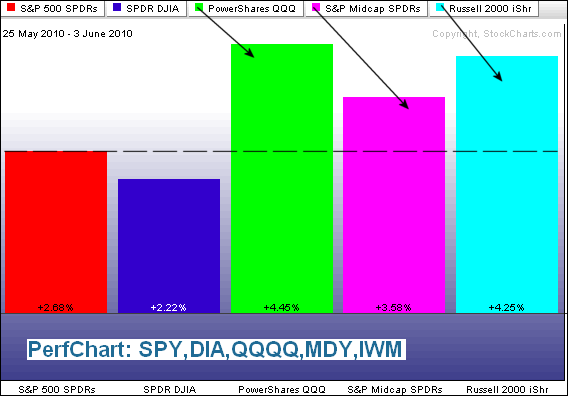
Even though the Dow gained just .06% and the S&P 500 was up .46%, the Nasdaq gained .96% and the Russell 2000 was up 1.05%. Techs and small-caps doubled the gains seen in the large-cap dominated S&P 500. Relative strength in these two groups is positive because it shows an increased appetite for risk. SPY bottomed with the weak open on May 25th, seven trading days ago. The perfchart below shows performance for SPY, DIA, QQQQ, MDY and IWM. The latter three are outperforming SPY and DIA by a rather wide margin. I was also impressed to see the stock market finish strong even as the Euro ETF sunk to its lows for the day. It was also surprising to see gold fall sharply in the face of Euro weakness. Perhaps the US market and gold have already discounted a weak Euro. Are there any Euro bulls or Dollar bears out there? Euro sentiment seems to be overwhelmingly bearish. Come to think of it, gold sentiment seems to be overwhelmingly bullish.

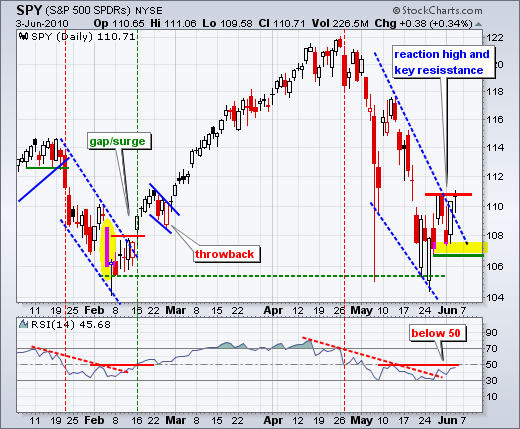
There is not much change on the daily chart. SPY dipped below 110 intraday, but recovered and closed near its high for the day. The trendline breakout is still holding. With another positive close, SPY managed to put together two consecutive up days for the first time since late April. The support zone around 107 holds the key to my bullish bias. SPY is trying to turn the corner, but has yet to break above the late May high with good volume and breadth. Today's employment report will provide a good excuse to succeed or fail. RSI is also at its make-or-break point. A break above 50 would be bullish for momentum, while another failure would keep momentum in the bearish camp.
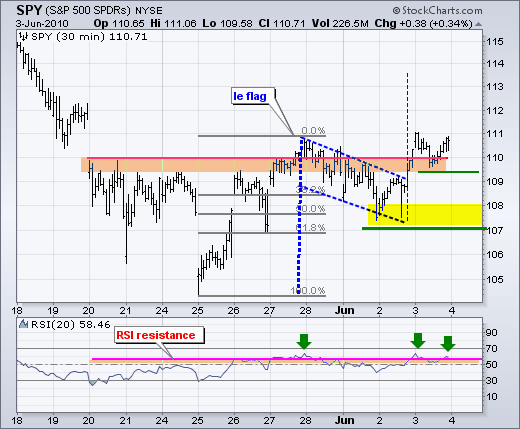
On the 30-minute chart, SPY has a falling flag breakout working that signals a continuation of the late May advance and targets further strength towards the 113.50 area. Flags fly at half mast and the first part of the pole extends from ~105 to ~111 (~6 points). A 6 point advance from the flag low (~107.5) would target a gain to around 113.5. Failure to hold the breakout and a move below 109 would be negative. A break below 107 would totally negate this bullish sequence.
Key Economic Reports:
Fri - Jun 03 - 10:00 - ISM Services
Fri - Jun 04 - 08:30 - Employment Report
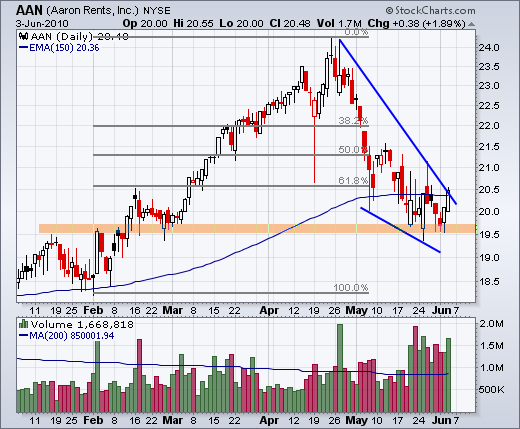
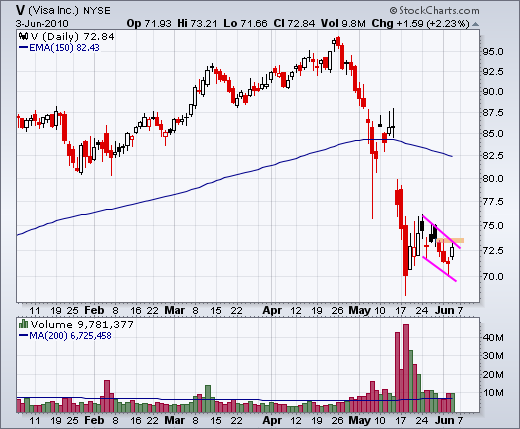
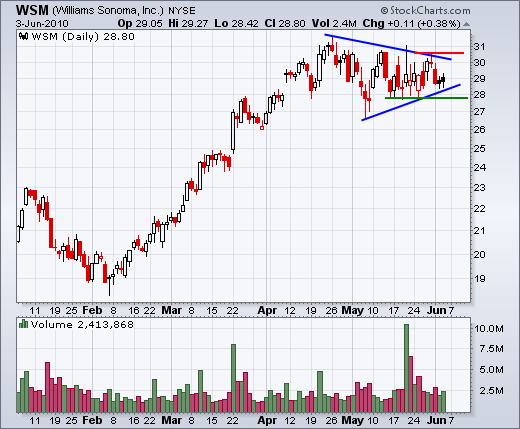
Charts of Interest: AAN, AKS, DISH, MA, NEM, V, WSM
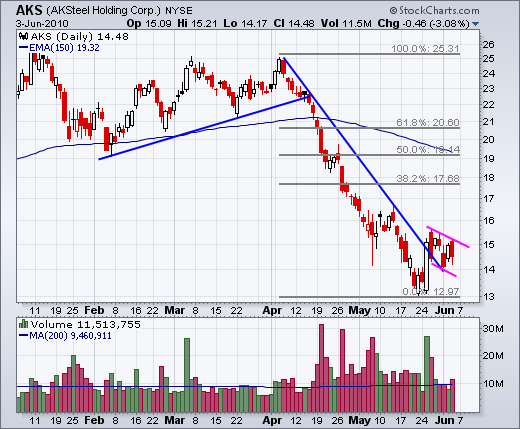
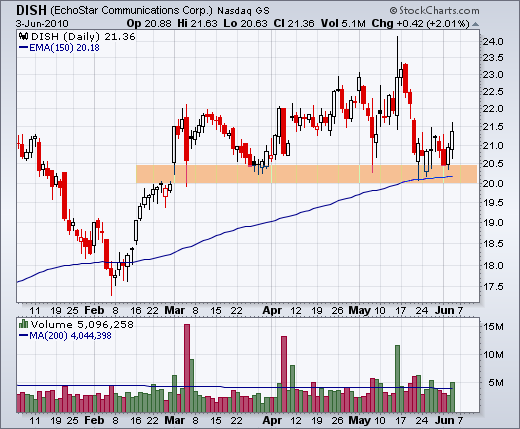
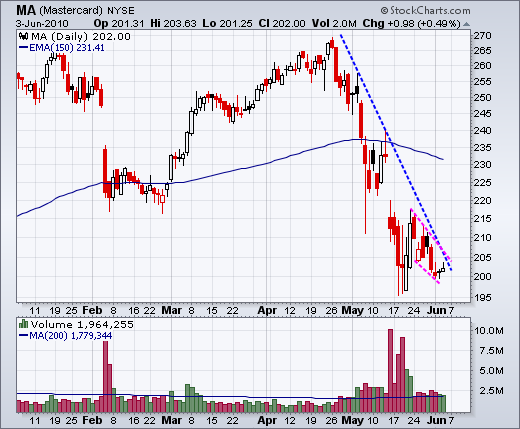
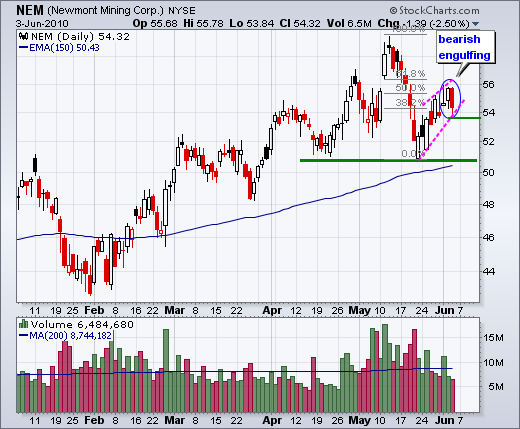
This commentary and charts-of-interest are designed to stimulate thinking. This analysis is not a recommendation to buy, sell, hold or sell short any security (stock ETF or otherwise). We all need to think for ourselves when it comes to trading our own accounts. First, it is the only way to really learn. Second, we are the only ones responsible for our decisions. Think of these charts as food for further analysis. Before making a trade, it is important to have a plan. Plan the trade and trade the plan. Among other things, this includes setting a trigger level, a target area and a stop-loss level. It is also important to plan for three possible price movements: advance, decline or sideways. Have a plan for all three scenarios BEFORE making the trade. Consider possible holding times. And finally, look at overall market conditions and sector/industry performance.

On the 30-minute chart, SPY has a falling flag breakout working that signals a continuation of the late May advance and targets further strength towards the 113.50 area. Flags fly at half mast and the first part of the pole extends from ~105 to ~111 (~6 points). A 6 point advance from the flag low (~107.5) would target a gain to around 113.5. Failure to hold the breakout and a move below 109 would be negative. A break below 107 would totally negate this bullish sequence.

Key Economic Reports:
Fri - Jun 03 - 10:00 - ISM Services
Fri - Jun 04 - 08:30 - Employment Report
Charts of Interest: AAN, AKS, DISH, MA, NEM, V, WSM


This commentary and charts-of-interest are designed to stimulate thinking. This analysis is not a recommendation to buy, sell, hold or sell short any security (stock ETF or otherwise). We all need to think for ourselves when it comes to trading our own accounts. First, it is the only way to really learn. Second, we are the only ones responsible for our decisions. Think of these charts as food for further analysis. Before making a trade, it is important to have a plan. Plan the trade and trade the plan. Among other things, this includes setting a trigger level, a target area and a stop-loss level. It is also important to plan for three possible price movements: advance, decline or sideways. Have a plan for all three scenarios BEFORE making the trade. Consider possible holding times. And finally, look at overall market conditions and sector/industry performance.

About the author:
Arthur Hill, CMT, is the Chief Technical Strategist at TrendInvestorPro.com. Focusing predominantly on US equities and ETFs, his systematic approach of identifying trend, finding signals within the trend, and setting key price levels has made him an esteemed market technician. Arthur has written articles for numerous financial publications including Barrons and Stocks & Commodities Magazine. In addition to his Chartered Market Technician (CMT) designation, he holds an MBA from the Cass Business School at City University in London.
Learn More


