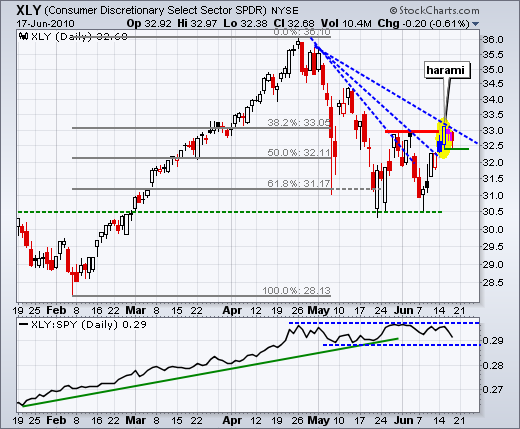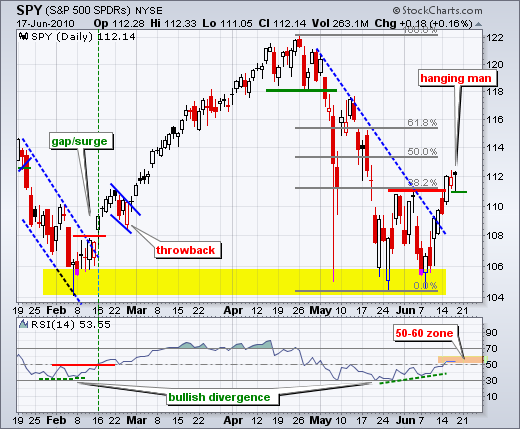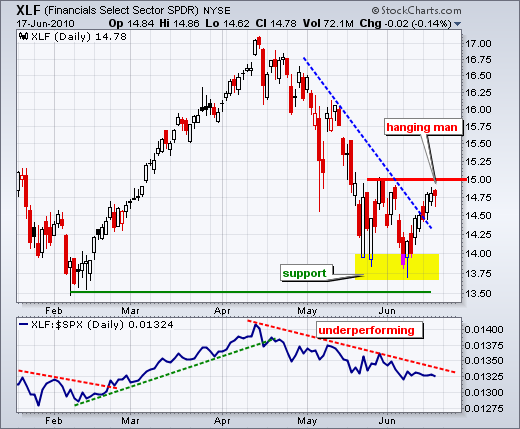
On the daily chart, SPY stalled with a hanging man on Thursday. Combined with the Tuesday-Wednesday harami, the ETF is showing signs of indecision as it trades above resistance. The ability to hold the resistance breakout shows underlying strength and bullish persistence. However, I remain concerned because of relative strength in bonds/gold and relative weakness in finance/consumer discretionary. A move below today's low would be the first step to confirming the hanging man and a short-term pullback. As noted before, SPY broke out in mid February and then pulled back with a falling flag in late February. Pullbacks and/or consolidations after a big surge are normal. Also note that RSI is trading in the 50-60 zone, which marks resistance in a downtrend. While the SPY trend is technically up after the breakout, RSI is still at a make-or-break level. A move back below 50 would be negative for momentum.
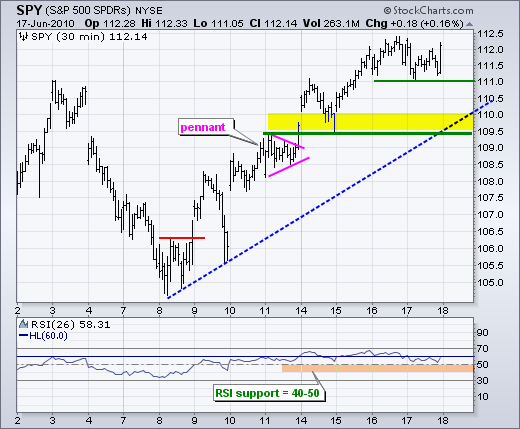
On the 30-minute chart, SPY consolidated throughout the day and established support at 111, which is the same as the hanging man low. A break below this level would trigger the first bearish signal and target a move towards the next support zone around 109.5-110.
Key Economic Reports: None today.
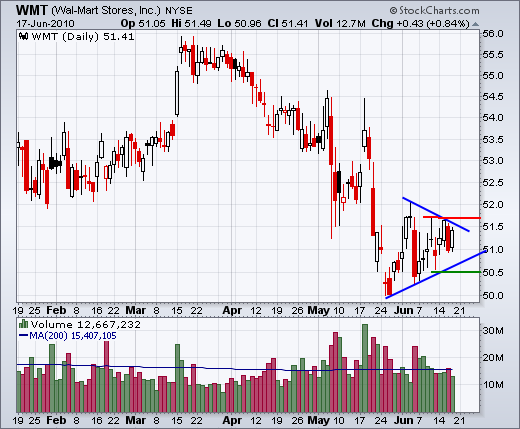
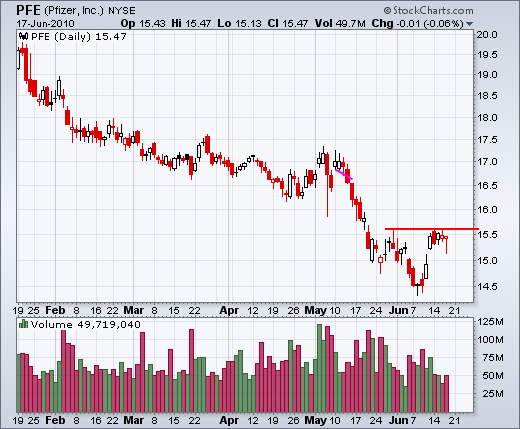
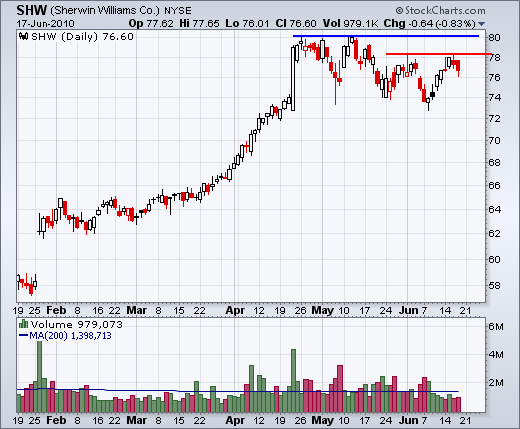
Charts of Interest: ERTS, PFE, SHW, WMT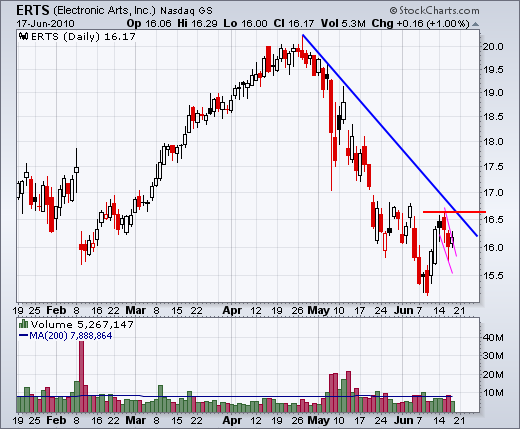
This commentary and charts-of-interest are designed to stimulate thinking. This analysis is not a recommendation to buy, sell, hold or sell short any security (stock ETF or otherwise). We all need to think for ourselves when it comes to trading our own accounts. First, it is the only way to really learn. Second, we are the only ones responsible for our decisions. Think of these charts as food for further analysis. Before making a trade, it is important to have a plan. Plan the trade and trade the plan. Among other things, this includes setting a trigger level, a target area and a stop-loss level. It is also important to plan for three possible price movements: advance, decline or sideways. Have a plan for all three scenarios BEFORE making the trade. Consider possible holding times. And finally, look at overall market conditions and sector/industry performance.

