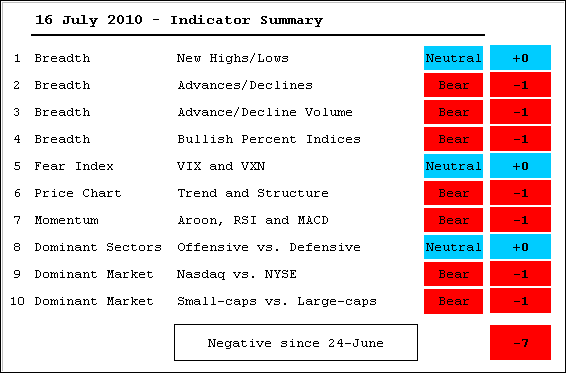
Even though last week's bounce continued this week, the indicator summary remains negative. The AD Lines and AD Volume Lines surged, but remain below their June highs (resistance). Another strong week would likely push these indicators above resistance and into bull mode. This means Mr Market is at its moment-of-truth. Net New Highs edged into positive territory, but have yet to break above their June highs. The mid June rally lasted nine days (+6.5%) before reversing. The current rally is now eight days long (+7.3%).


- AD Lines: Bearish. The Nasdaq and NYSE AD Lines remain in downtrends with a series of lower lows and lower highs extending down from the April high. The NYSE is showing some resilience as it nears its June high for a resistance test.
- AD Volume Lines: Bearish. The Nasdaq and NYSE AD Volume Line remain in downtrends with a series of lower lows and lower highs extending down from the April high.
- Net New Highs: Neutral. Nasdaq Net New Highs crept into positive territory this week, but the 10-day SMA remains negative. NYSE Net New Highs were above 50 all week and the 10-day SMA turned positive.
- Bullish Percent Indices: Bearish. Except for the consumer staples and utilities sectors, BPIs remain below 50% and bearish overall. The Dow 30 Bullish Percent Index is at 50%.
- Sentiment: Neutral. The S&P 500 Volatility Index ($VIX) and Nasdaq 100 Volatility Index ($VXN) formed lower highs in mid June and are now testing support from the June lows. A break below these lows would be positive for stocks.
- Trend Structure: Bearish. The major index ETFs have yet to break above their June highs. SPY and DIA are close, but QQQQ and IWM remain well below these resistance levels.
- SPY Momentum: Bearish. MACD (5,35,5) edged into positive territory and RSI moved into the 50-60 zone. Both tend to reverse in these areas when the trend is down so this is an important test. Aroon remains negative.
- Offensive Sector Performance: Neutral. Finance and technology are performing well, but consumer discretionary and industrials are lagging the broader market.
- Nasdaq Performance: Bearish. The $COMPQ:$NYA ratio has been moving lower since early June.
- Small-cap Performance: Bearish. The $RUT:$OEX ratio has been moving lower since April.
- Breadth Charts have been updated (click here)

About the author:
Arthur Hill, CMT, is the Chief Technical Strategist at TrendInvestorPro.com. Focusing predominantly on US equities and ETFs, his systematic approach of identifying trend, finding signals within the trend, and setting key price levels has made him an esteemed market technician. Arthur has written articles for numerous financial publications including Barrons and Stocks & Commodities Magazine. In addition to his Chartered Market Technician (CMT) designation, he holds an MBA from the Cass Business School at City University in London.
Learn More


