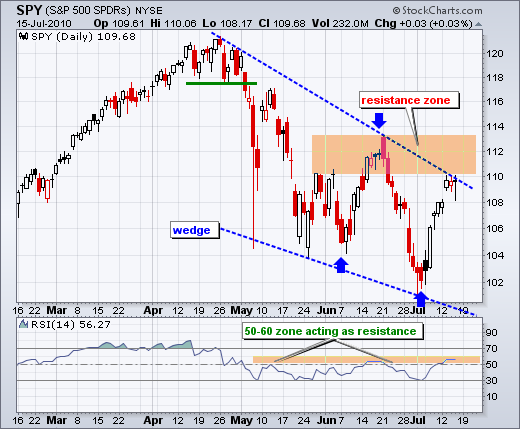
There is no change on the daily chart as SPY stalls just below its big resistance zone. On a closing basis, there have been three moves in excess of 6% over the last 26 days (blue arrows). First, SPY bottomed on June 7th and advanced 6.4% in nine days. Second, the ETF peaked on June 18th and fell 8.5% in ten days. Most recently, SPY bottomed on July 2nd and surged 7.3% the last eight days. Despite the most recent surge, the trend on the daily chart remains down as SPY trades within a falling wedge. The ETF has a series of lower lows and lower highs since April. With Tuesday's gap/surge, the ETF hit the lower end of its resistance zone and the wedge trendline. In addition, RSI moved further into the 50-60 zone, which acts as resistance in a downtrend, provided the trend remains down. The downtrend is at its moment-of-truth. It is time to fail at resistance or continue higher and break resistance.


SPY moved sharply lower on the open, but quickly found support and surged into the close. News of the successful cap on the Deep Water Horizon well spurred buying in energy stocks. News of a Goldman Sachs settlement pushed GS sharply higher to help financials, which were also helped by passage of the financial regulatory reform bill. Three pieces of unfinished business were finished. The market hates uncertainty and three pieces of uncertainty were removed yesterday.
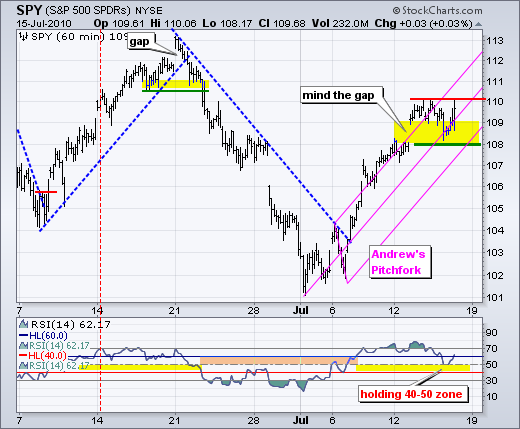
On the 60-minute chart, SPY bounced off 108 and continues to hold the gap. With this small reaction low, I am raising short-term support to 108. This area is also confirmed by the lower trendline from Andrew's Pitchfork. The bulls remain resilient and a break above this week's high would signal a continuation higher. Resistance from the mid June highs around 112-113 marks the next target. RSI remains in bull mode as it bounced off the 40-50 zone. A move below 40 is needed to reverse bullish momentum.

Key Economic Reports:
Fri - Jul 16 - 08:30 - CPI
Fri - Jul 16 - 09:55 - Mich Sentiment
Charts of Interest: None today.
This commentary and charts-of-interest are designed to stimulate thinking. This analysis is not a recommendation to buy, sell, hold or sell short any security (stock ETF or otherwise). We all need to think for ourselves when it comes to trading our own accounts. First, it is the only way to really learn. Second, we are the only ones responsible for our decisions. Think of these charts as food for further analysis. Before making a trade, it is important to have a plan. Plan the trade and trade the plan. Among other things, this includes setting a trigger level, a target area and a stop-loss level. It is also important to plan for three possible price movements: advance, decline or sideways. Have a plan for all three scenarios BEFORE making the trade. Consider possible holding times. And finally, look at overall market conditions and sector/industry performance.

About the author:
Arthur Hill, CMT, is the Chief Technical Strategist at TrendInvestorPro.com. Focusing predominantly on US equities and ETFs, his systematic approach of identifying trend, finding signals within the trend, and setting key price levels has made him an esteemed market technician. Arthur has written articles for numerous financial publications including Barrons and Stocks & Commodities Magazine. In addition to his Chartered Market Technician (CMT) designation, he holds an MBA from the Cass Business School at City University in London.
Learn More


