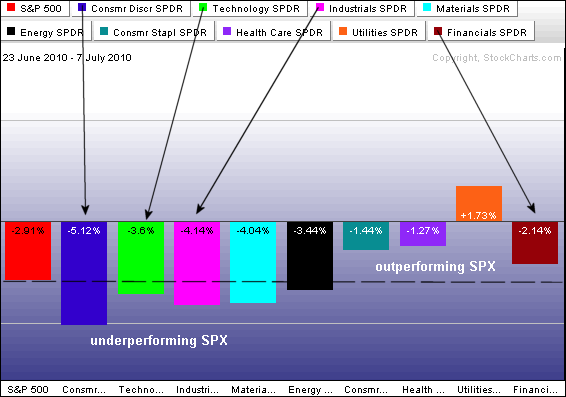
Stocks surged yesterday with a pretty strong advance. Advances swamped declines and advancing volume far exceeded declining volume - on both the NYSE and the Nasdaq. Volume was light, but volume should be light during the summer so I am not concerned with volume at this point. All sectors were up with the Financials SPDR (XLF) gaining 4.41%. Six of the nine sectors were up over 3%. The consumer discretionary was up 2.82%. Healthcare and consumer staples were up less than 2%. The perfchart below shows sector performance relative to the S&P 500 over the last 10 days. The consumer discretionary, technology and industrials sectors have shown relative weakness, which is not a good sign. Conversely, the finance sector has shown relative strength, which is positive. Consumer staples, healthcare and utilities also show relative strength, which reflects a defensive oriented market. In fact, the utilities sector is the only sector showing a gain the last 10 days.
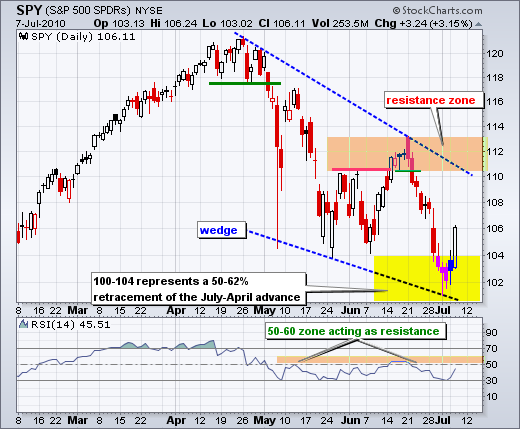
On the daily chart, SPY remains in a downtrend overall with a falling wedge taking shape. It is important to distinguish between the short-term and medium-term trends or conditions. One can expect a short-term bounce within a medium-term downtrend. SPY became way oversold after a 2 week ~10% plunge. Sentiment was overtly bearish as well. These conditions made the market ripe for an oversold bounce. Although strong, one day is not enough to reverse the downtrend on the daily chart. The index remains below the April trendline and RSI has yet to even challenge the 50-60 zone.

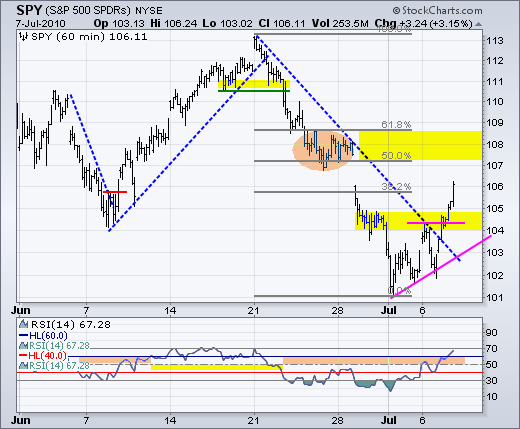
On the 60-minute chart, SPY broke through resistance and RSI broke 60 to reverse the short-term downtrend. I can now use the Fibonacci Retracements Tool and prior consolidations to project the next resistance levels. A 50-62% retracement would extend to the 107.5-108.5 area. There is also a small consolidation in this area. As far as support, there is a broken resistance zone around 104-105 that turns into support. A falling flag or wedge that returns to this area could provide a short-term bullish setup to play a continuation of this short-term advance.

Key Economic Reports:
Thu - Jul 08 - 07:00 - Euro Central Bank policy statement
Wed - Jul 08 - 08:30 - Initial Claims
Charts of Interest: None today.
This commentary and charts-of-interest are designed to stimulate thinking. This analysis is not a recommendation to buy, sell, hold or sell short any security (stock ETF or otherwise). We all need to think for ourselves when it comes to trading our own accounts. First, it is the only way to really learn. Second, we are the only ones responsible for our decisions. Think of these charts as food for further analysis. Before making a trade, it is important to have a plan. Plan the trade and trade the plan. Among other things, this includes setting a trigger level, a target area and a stop-loss level. It is also important to plan for three possible price movements: advance, decline or sideways. Have a plan for all three scenarios BEFORE making the trade. Consider possible holding times. And finally, look at overall market conditions and sector/industry performance.

About the author:
Arthur Hill, CMT, is the Chief Technical Strategist at TrendInvestorPro.com. Focusing predominantly on US equities and ETFs, his systematic approach of identifying trend, finding signals within the trend, and setting key price levels has made him an esteemed market technician. Arthur has written articles for numerous financial publications including Barrons and Stocks & Commodities Magazine. In addition to his Chartered Market Technician (CMT) designation, he holds an MBA from the Cass Business School at City University in London.
Learn More


