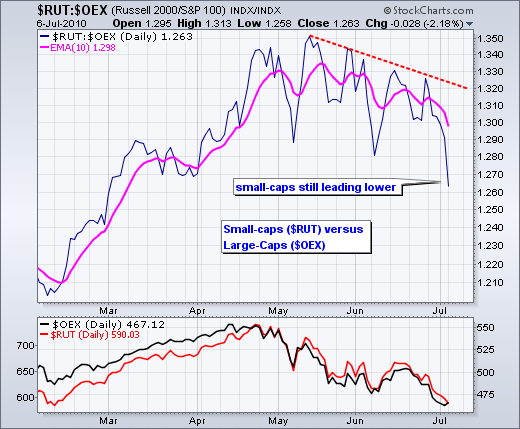
Stocks were strangely mixed on Tuesday with the large-cap indices edging higher and the small-cap indices falling rather sharply. The S&P 500 and Dow gained around .50%, but the Russell 2000 and S&P 600 SmallCap Index lost around 1.50%. The Russell 2000 was up over 2% before an afternoon fall that pushed it into negative territory. The shortness of yesterday's pop and relative weakness in small-caps are negative overall. A solid bounce involves a strong open, follow through during the day and a strong close. Even though stocks are still oversold, the bears maintain their edge until the bulls can put together a convincing bounce.

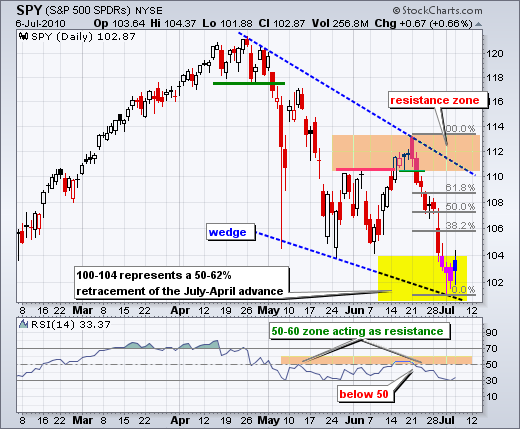
On the daily chart, SPY shows some signs of firmness over the last three days, but no real strength. Firmness after a sharp decline can simply be a rest before a continuation lower. Even though SPY is oversold and trading within a retracement zone, it could still become more oversold and extend to the edge of its retracement zone. A move to 100 would mark a 62% retracement of the July-April advance, which was the last leg up. At this stage, I am still waiting for a convincing 1-2 day surge to establish support before considering the possibility of a sustainable low.
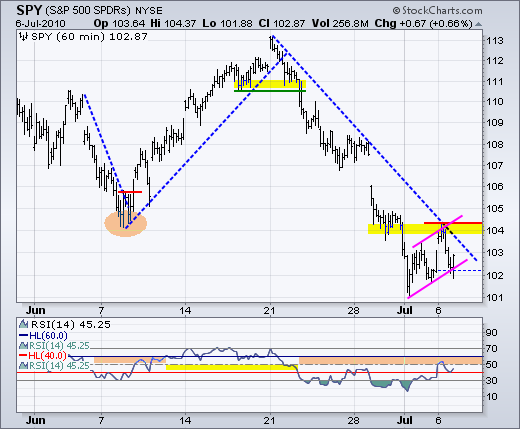
I am showing the 60-minute chart today for a little more perspective. After becoming oversold in early July, SPY edged higher last week and bounced with a surge above 104 early Tuesday. This gap-surge did not last long. There was no follow through after the gap and the ETF turned down in the afternoon. The gap was filled, but SPY remains above its prior low. A rising flag is taking shape over the last few days and further weakness today would extend the overall downtrend. While I still think it is a bit late for shorts, Jesse Livermore always said it was never too late to begin selling (or buying) a stock (Reminiscences of a Stock Operator). Also notice that RSI hit resistance in the 50-60 zone. Three things are required for a trend reversal here: a trendline break, a resistance break and a RSI break above 60. I would like to see these first before looking for a potentially bullish pullback (flag/wedge/retracement).
Key Economic Reports:
Tue - Jul 06 - 10:00 - ISM Services
Wed - Jul 07 - 10:30 - Crude Inventories
Thu - Jul 08 - 07:00 - Euro Central Bank policy statement
Wed - Jul 08 - 08:30 - Initial Claims
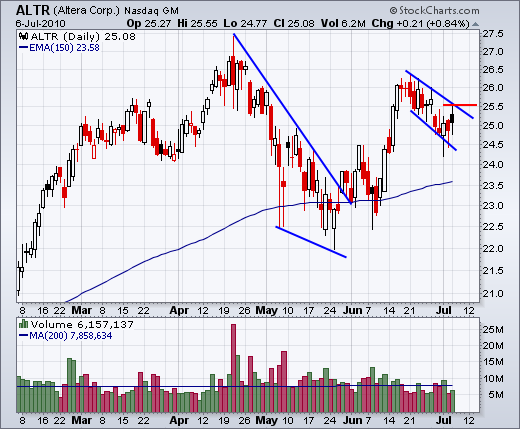
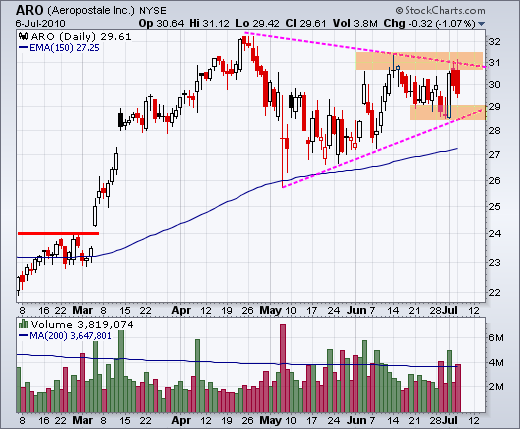
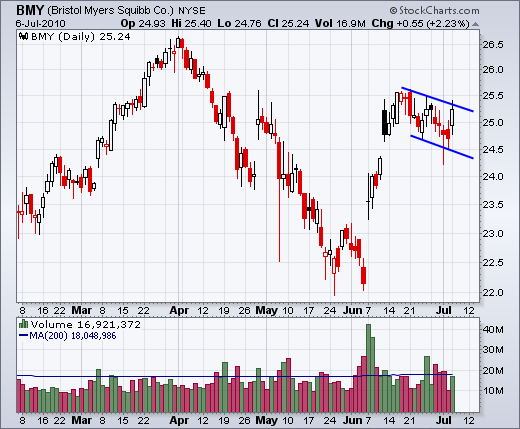
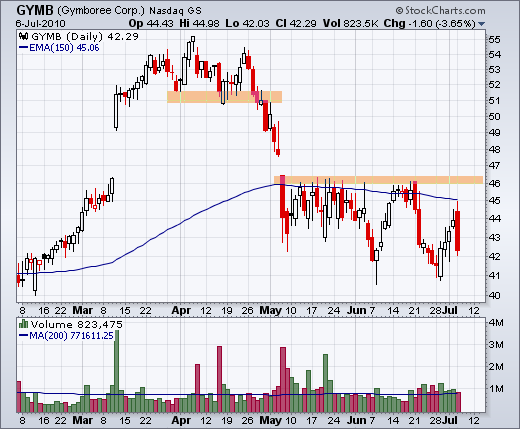
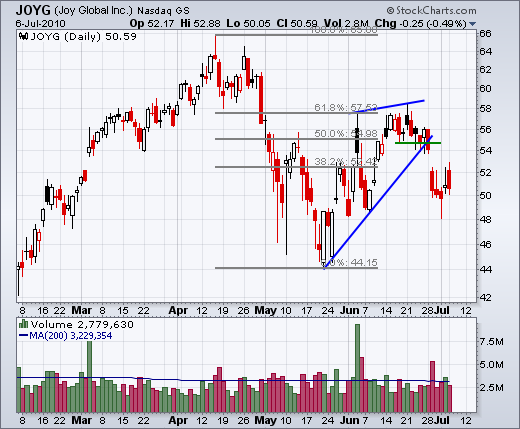
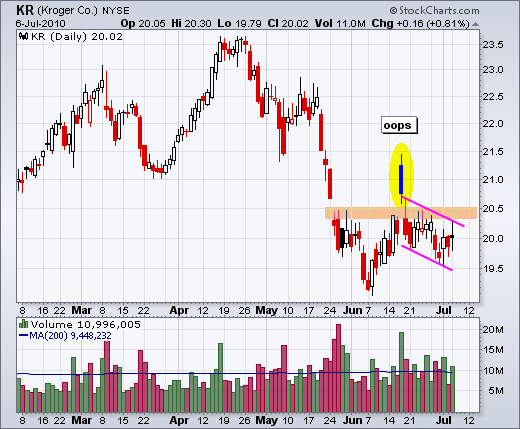
Charts of Interest: ALTR, ARO, BMY, GYMB, JOYG, KR, URBN
This commentary and charts-of-interest are designed to stimulate thinking. This analysis is not a recommendation to buy, sell, hold or sell short any security (stock ETF or otherwise). We all need to think for ourselves when it comes to trading our own accounts. First, it is the only way to really learn. Second, we are the only ones responsible for our decisions. Think of these charts as food for further analysis. Before making a trade, it is important to have a plan. Plan the trade and trade the plan. Among other things, this includes setting a trigger level, a target area and a stop-loss level. It is also important to plan for three possible price movements: advance, decline or sideways. Have a plan for all three scenarios BEFORE making the trade. Consider possible holding times. And finally, look at overall market conditions and sector/industry performance.
About the author:
Arthur Hill, CMT, is the Chief Technical Strategist at TrendInvestorPro.com. Focusing predominantly on US equities and ETFs, his systematic approach of identifying trend, finding signals within the trend, and setting key price levels has made him an esteemed market technician. Arthur has written articles for numerous financial publications including Barrons and Stocks & Commodities Magazine. In addition to his Chartered Market Technician (CMT) designation, he holds an MBA from the Cass Business School at City University in London.
Learn More
