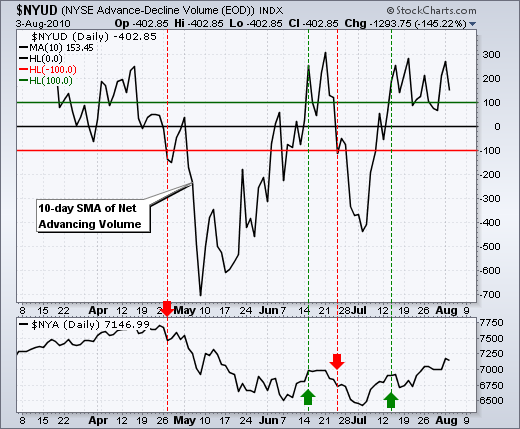
The NYSE and NY Composite have been driving the current rally. NYSE breadth has been stronger than Nasdaq breadth and the NY Composite has far outperformed the Nasdaq over the last five weeks. The leader will offer the first clues of a potential reversal. The chart below shows the 10-day SMA for NYSE Net Advancing Volume. The green line is set at +100 and the red line is at -100. These are the bullish and bearish thresholds. A move above +100 shows significant buying pressure, while a move below -100 shows significant selling pressure. This is not a stand alone system and there will be whipsaws, but it can help determine short-term direction. Current direction favors the bulls as the indicator moved above +100 in mid July and remains positive. Look for a move below -100 to reverse this indicator.


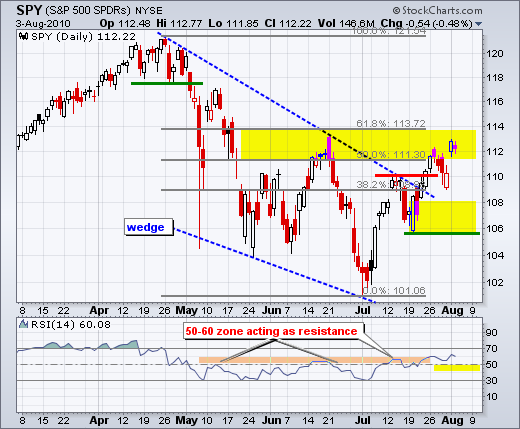
After Monday's gap and surge above 112, stocks took a breather on Tuesday with an inside day. This is also known as a harami in candlestick lore. Harami and inside days signal indecision that can sometimes foreshadow a reversal. This pattern carries extra potential with SPY trading in a resistance zone from the key retracements and the June high. For now, the gap and surge above 112 are holding. A move below 110 would fill the gap and a break below last week's low would provide the first significant sign of weakness. For now, 106-108 marks the medium-term support zone on the daily chart.

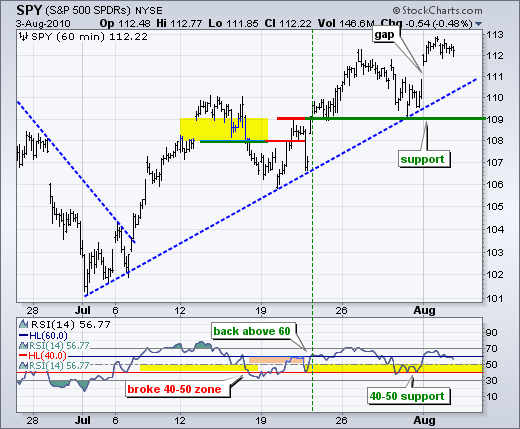
The 60-minute chart simply affirms the significance of support at 109. Also notice that RSI is hovering above the 40-50 support zone. A break below 40 in RSI and 109 in SPY would be short-term bearish. There are three important economic reports left this week. Today's ISM Services report favors economic expansion as long as it holds above 50. Jobless claims on Thursday morning will shed some light on Friday's employment report. Initial jobless claims have been hovering around 450,000 the entire year. Thursday's consensus is for 455,000. Anything below 450,000 would be positive. Anything above 460,000 would be negative. While the world is waiting on Friday's number, initial claims could trigger a big move on Thursday.

Key Economic Reports:
Wed - Aug 04 - 10:00 - ISM Services Index
Wed - Aug 04 - 10:30 - Crude Inventories
Thu - Aug 05 - 08:30 - Jobless Claims
Fri - Aug 06 - 08:30 - Employment Report
Charts of Interest: None today.
This commentary and charts-of-interest are designed to stimulate thinking. This analysis is not a recommendation to buy, sell, hold or sell short any security (stock ETF or otherwise). We all need to think for ourselves when it comes to trading our own accounts. First, it is the only way to really learn. Second, we are the only ones responsible for our decisions. Think of these charts as food for further analysis. Before making a trade, it is important to have a plan. Plan the trade and trade the plan. Among other things, this includes setting a trigger level, a target area and a stop-loss level. It is also important to plan for three possible price movements: advance, decline or sideways. Have a plan for all three scenarios BEFORE making the trade. Consider possible holding times. And finally, look at overall market conditions and sector/industry performance.

About the author:
Arthur Hill, CMT, is the Chief Technical Strategist at TrendInvestorPro.com. Focusing predominantly on US equities and ETFs, his systematic approach of identifying trend, finding signals within the trend, and setting key price levels has made him an esteemed market technician. Arthur has written articles for numerous financial publications including Barrons and Stocks & Commodities Magazine. In addition to his Chartered Market Technician (CMT) designation, he holds an MBA from the Cass Business School at City University in London.
Learn More


