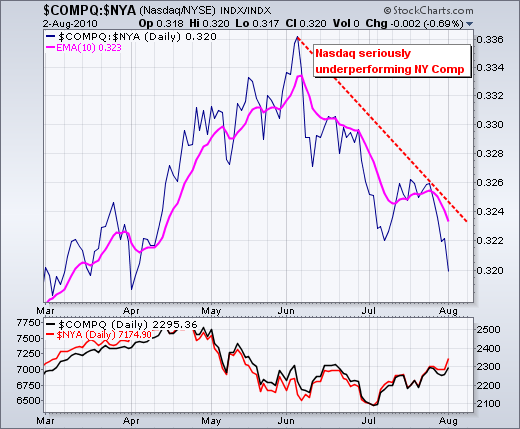
The bulls came out charging on Monday. Strength in European banks and equities triggered yesterday's strong open. More importantly, stocks remained strong throughout the day and the major index ETFs closed near their highs for the session. NYSE breadth was strong, but Net Advances, Net Advancing Volume and Net New Highs for the Nasdaq finished below last week's highs. Relative weakness in the Nasdaq breadth indicators is cause for concern, but the bullish evidence currently outweighs the bearish evidence. I am also concerned that the Nasdaq is lagging the NY Composite and small-caps were relatively weak yesterday.

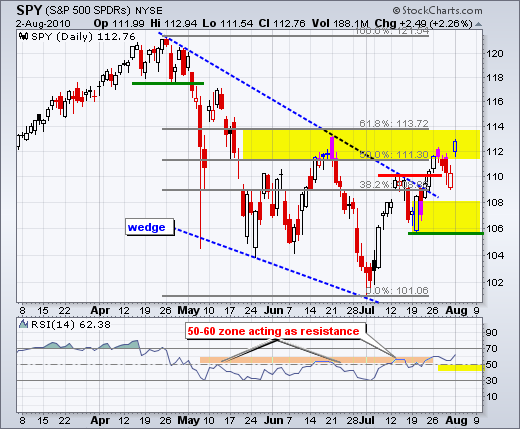
Monday's big gain pushed the S&P 500 ETF (SPY) into its resistance zone with a gap higher. Even though resistance is nigh, the July surge is certainly strong. The last two pullbacks were limited to just a few days and the rally resumed with vigor. Medium-term, there is still resistance around 112 from the mid June highs and the 50-62% retracement zone. Despite potential resistance, there are simply no signs of material weakness. Tuesday's gap and last week's low now mark the first support zone to watch for signs of trouble. A move below last week's low would fill this gap and argue for a deeper pullback.
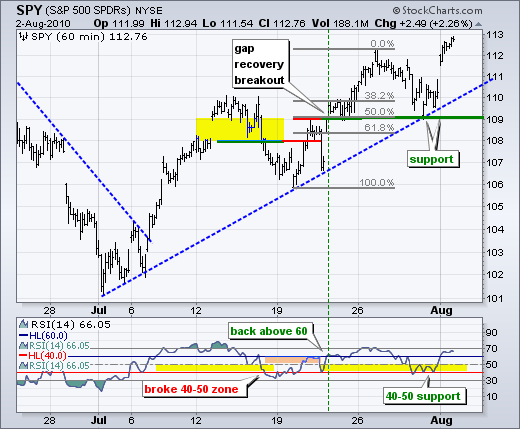
On the 60-minute chart, last week's low marks a support zone around 109-110. RSI also held the 40-50 support zone with a surge back towards 70. The lines in the sand have been drawn. The bulls are in full control as long as support at 109 holds on the price chart and RSI holds above 40. The economic docket is quite full this week and culminates with the employment report on Friday. Even though we are seeing consolidation breakouts in many stocks, risk is above average when market conditions are overbought heading into the employment report. In other words, expectations are now quite high and the market may look for any excuse to take some profits.
Key Economic Reports:
Tue - Aug 03 - 08:30 - Personal Income-Spending
Tue - Aug 03 - 10:00 - Factory Orders
Tue - Aug 03 - 10:00 - Pending Home Sales
Tue - Aug 03 - 14:00 - Auto-Truck Sales
Wed - Aug 04 - 10:00 - ISM Services Index
Wed - Aug 04 - 10:30 - Crude Inventories
Thu - Aug 05 - 08:30 - Jobless Claims
Fri - Aug 06 - 08:30 - Employment Report
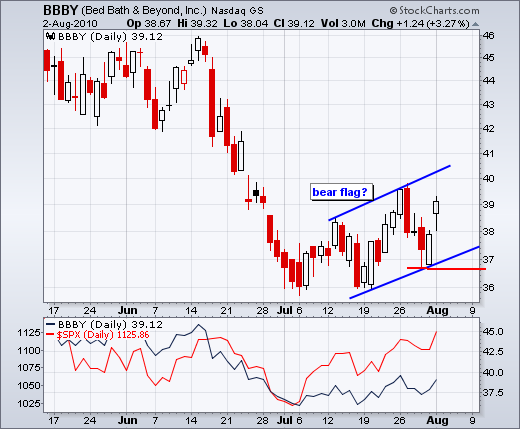
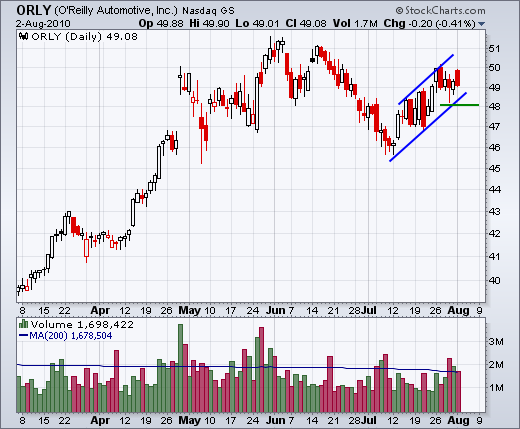
Charts of Interest: BBBY, CSCO, DELL, GOOG, NWSA, ORLY
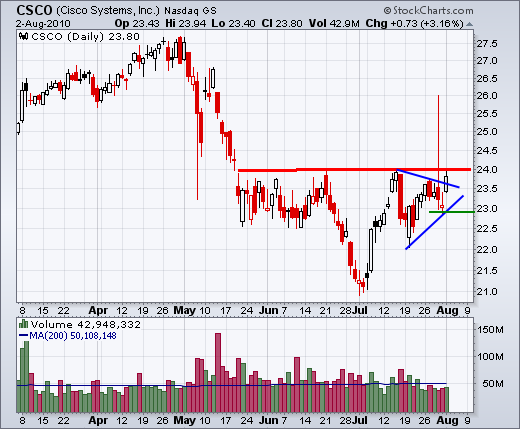
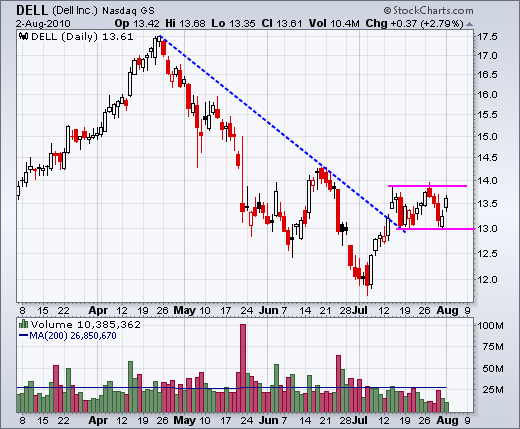
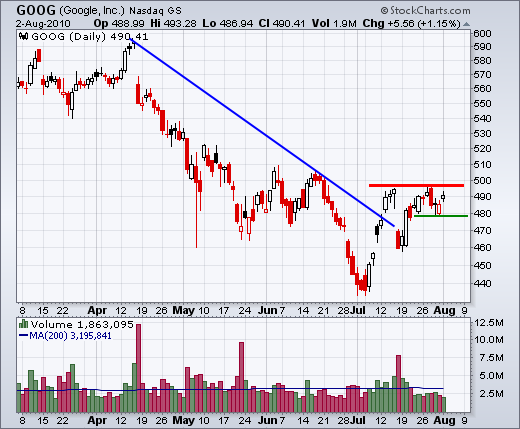
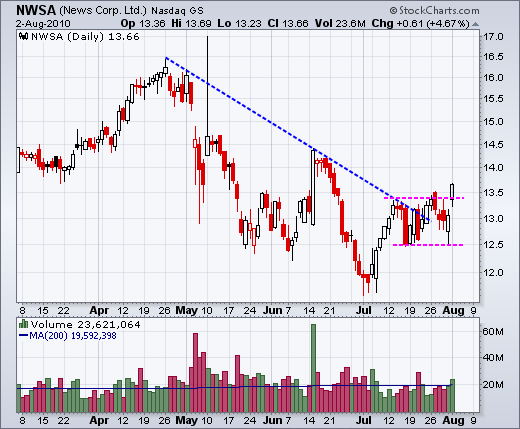
This commentary and charts-of-interest are designed to stimulate thinking. This analysis is not a recommendation to buy, sell, hold or sell short any security (stock ETF or otherwise). We all need to think for ourselves when it comes to trading our own accounts. First, it is the only way to really learn. Second, we are the only ones responsible for our decisions. Think of these charts as food for further analysis. Before making a trade, it is important to have a plan. Plan the trade and trade the plan. Among other things, this includes setting a trigger level, a target area and a stop-loss level. It is also important to plan for three possible price movements: advance, decline or sideways. Have a plan for all three scenarios BEFORE making the trade. Consider possible holding times. And finally, look at overall market conditions and sector/industry performance.

About the author:
Arthur Hill, CMT, is the Chief Technical Strategist at TrendInvestorPro.com. Focusing predominantly on US equities and ETFs, his systematic approach of identifying trend, finding signals within the trend, and setting key price levels has made him an esteemed market technician. Arthur has written articles for numerous financial publications including Barrons and Stocks & Commodities Magazine. In addition to his Chartered Market Technician (CMT) designation, he holds an MBA from the Cass Business School at City University in London.
Learn More


