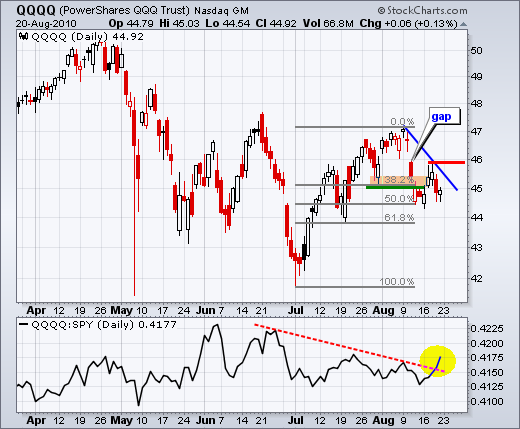
The August trend remains down for the major index ETFs, but techs are starting to show relative strength with QQQQ edging higher on Friday. Despite some signs of firmness, we have yet to see any signs of significant strength that would warrant a bullish stance. The first chart shows the Nasdaq 100 ETF (QQQQ) firming near the 50% retracement mark over the last seven days. As the chart now stands, the gap below 46 still dominates and is bearish until proven otherwise. A strong move back above 46 would warrant a reassessment of my bearish stance. The indicator window shows the price relative comparing QQQQ to SPY. This indicator turned up last week and broke its red trendline. QQQQ is starting to show relative strength.


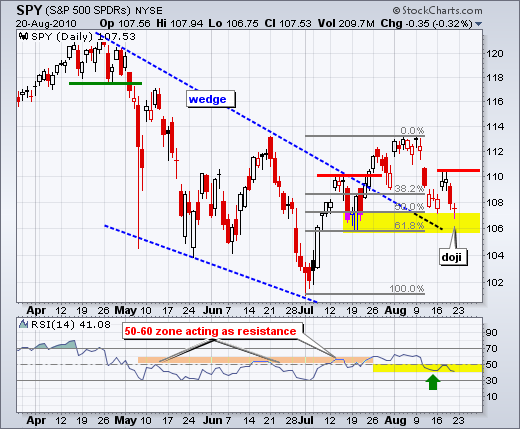
After a sharp decline and long red candlestick on Thursday, SPY firmed near retracement support with a doji on Friday. Hypothetically, a gap up and long white candlestick today would produce a morning doji star, which would be bullish. Support in the 106-107 zone stems from the 50-62% retracements and the July-August lows. In addition, notice that RSI is firming in the 40-50 zone. Support is one thing. A reversal is another. At this point, we still need to see strong buying pressure before moving to the bullish camp.

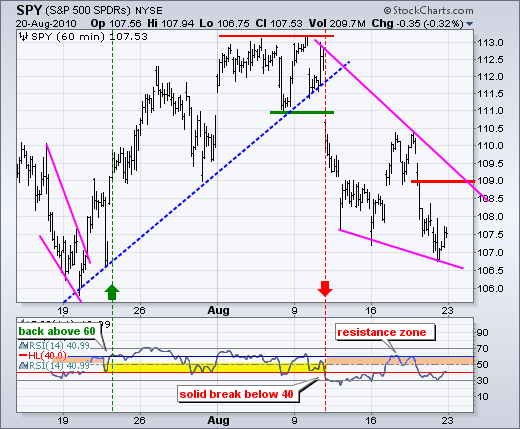
On the 60-minute chart, the August decline formed a falling wedge with a lower low and lower high. This is clearly a downtrend. SPY broke support at 109 with Thursday's decline and this level turns into key resistance for the short-term downtrend. A move above this level would also break the upper trendline of the falling wedge. Momentum remains bearish as RSI trades in the 20-60 zone. Look for a break above last week's highs to turn momentum bullish.

Key Economic Reports:
Tue - Aug 24 - 10:00 - Existing Home Sales
Wed - Aug 25 - 08:30 - Durable Orders
Wed - Aug 25 - 10:00 - New Home Sales
Wed - Aug 25 - 10:30 - Oil Inventories
Thu - Aug 26 - 08:30 - Jobless Claims
Fri - Aug 27 - 08:30 - GDP
Fri - Aug 27 - 09:55 - U Michigan Consumer Sentiment
Charts of Interest: Tuesday and Thursday.
This commentary and charts-of-interest are designed to stimulate thinking. This analysis is not a recommendation to buy, sell, hold or sell short any security (stock ETF or otherwise). We all need to think for ourselves when it comes to trading our own accounts. First, it is the only way to really learn. Second, we are the only ones responsible for our decisions. Think of these charts as food for further analysis. Before making a trade, it is important to have a plan. Plan the trade and trade the plan. Among other things, this includes setting a trigger level, a target area and a stop-loss level. It is also important to plan for three possible price movements: advance, decline or sideways. Have a plan for all three scenarios BEFORE making the trade. Consider possible holding times. And finally, look at overall market conditions and sector/industry performance.

About the author:
Arthur Hill, CMT, is the Chief Technical Strategist at TrendInvestorPro.com. Focusing predominantly on US equities and ETFs, his systematic approach of identifying trend, finding signals within the trend, and setting key price levels has made him an esteemed market technician. Arthur has written articles for numerous financial publications including Barrons and Stocks & Commodities Magazine. In addition to his Chartered Market Technician (CMT) designation, he holds an MBA from the Cass Business School at City University in London.
Learn More


