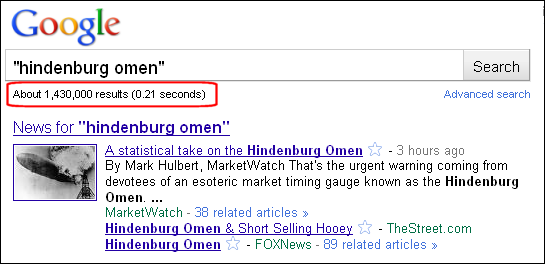
Despite excessively bearish sentiment, the technical conditions in the stock market are clearly bearish for the short-term and medium-term. Sentiment is hard to quantify, but I get the feeling that sentiment is overwhelmingly bearish as we head into the September-October period. Consider the following. First, the NY Times reports that individual investors are loosing their nerve when it comes to stocks. A whopping $33.12 billion was pulled from domestic stock market mutual funds so far in 2010. Second, the Hindenburg Omen got widespread press coverage the prior week. A Google search for "Hindenburg omen" produces over 1.4 million results. While I think there is some merit in the rational behind the Hindenburg Omen, widespread popularity makes me suspect. Third, 42.7% of AAII members were bearish as of August 18th. This number is relatively high, but it needs to climb above 50% to reach an extreme that could foreshadow a bottom.

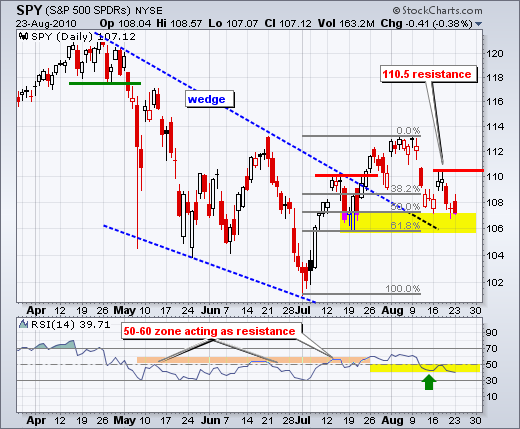
My sentiment suspicions take a back seat to technical conditions. Most of my short-term and medium-term indicators are pointing down. Even though SPY is near support from the mid July low and a key retracement zone, buying pressure appears to be drying up as we head into the dog days of August. Stocks can decline simply from a lack of buying pressure. A combination of last minute vacations and fear of September could keep buyers on the sidelines until September. On the daily chart, SPY opened strong and closed weak on low volume to confirm weak buying pressure. Resistance on the daily chart remains at 110.50.
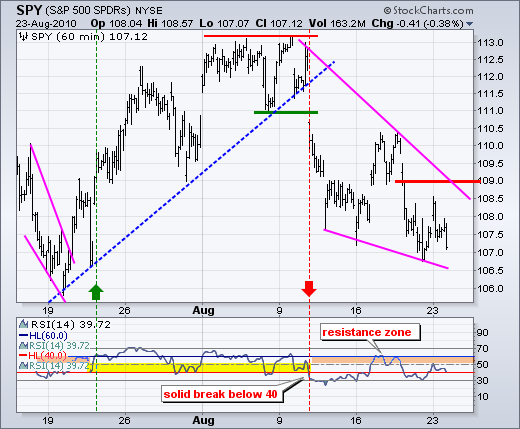
On the 60-minute chart, the falling wedge defines the current downtrend. I expect lower prices as long as the wedge falls and the downtrend remains in force. Key resistance remains at 109 on the price chart and around 60 for RSI. A move above these levels would reverse the current downtrend. At current levels, this would require an advance of 2% or so, which would be quite impressive in late summer.
Key Economic Reports:
Tue - Aug 24 - 10:00 - Existing Home Sales
Wed - Aug 25 - 08:30 - Durable Orders
Wed - Aug 25 - 10:00 - New Home Sales
Wed - Aug 25 - 10:30 - Oil Inventories
Thu - Aug 26 - 08:30 - Jobless Claims
Fri - Aug 27 - 08:30 - GDP
Fri - Aug 27 - 09:55 - U Michigan Consumer Sentiment
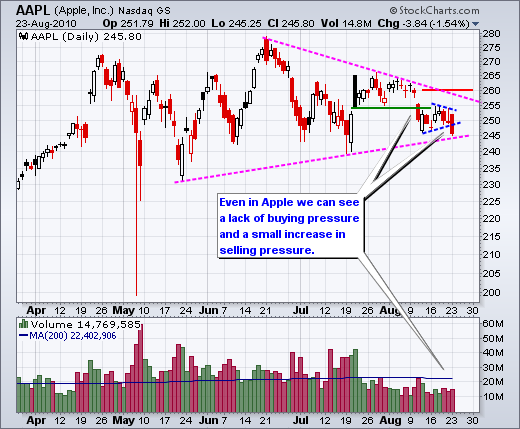
Charts of Interest: AAPL, APD, CAT, CHRW, FCX, JDSU, JNJ, KMX, X
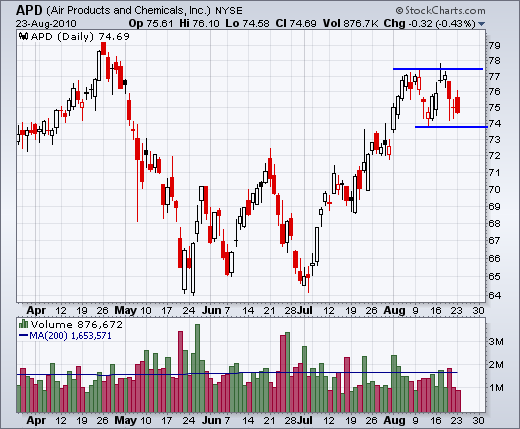
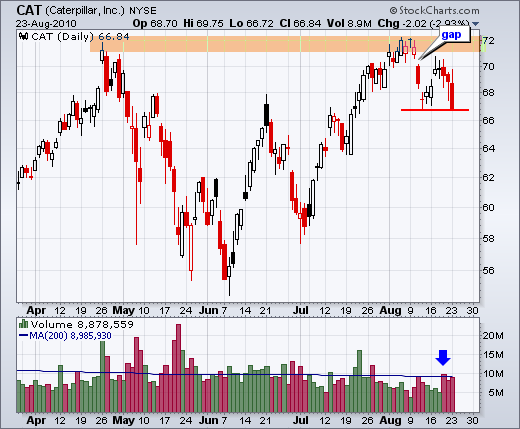
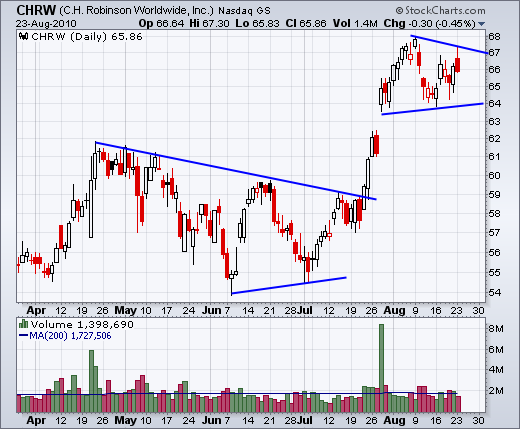
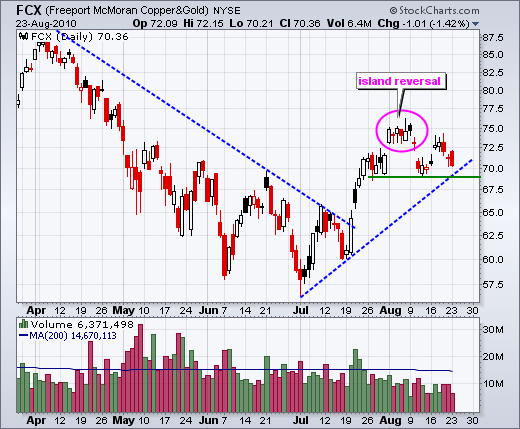
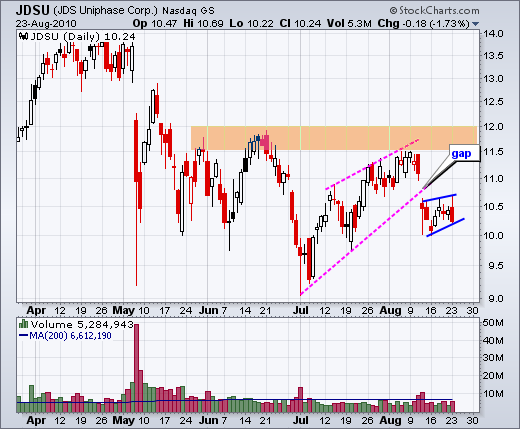
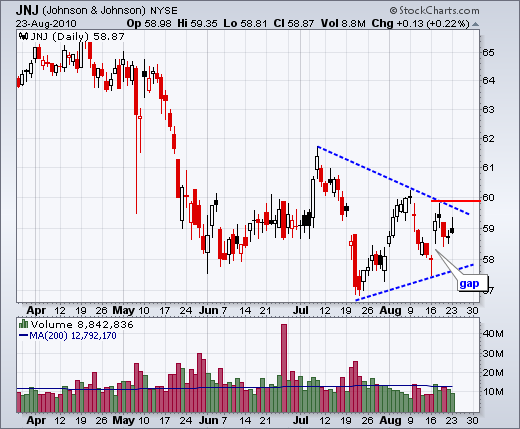
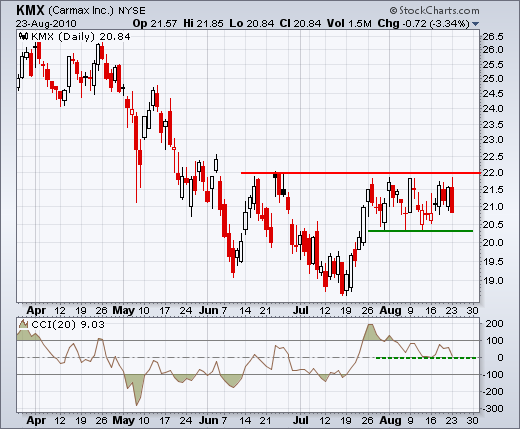
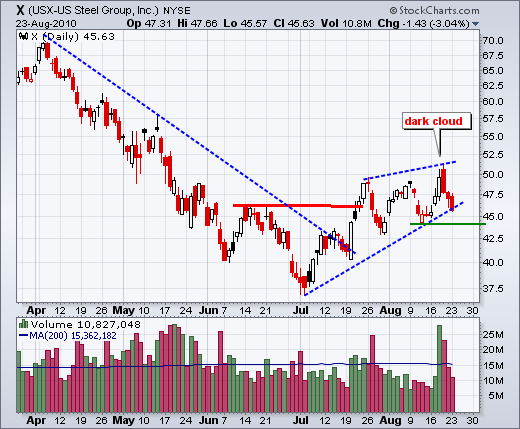
This commentary and charts-of-interest are designed to stimulate thinking. This analysis is not a recommendation to buy, sell, hold or sell short any security (stock ETF or otherwise). We all need to think for ourselves when it comes to trading our own accounts. First, it is the only way to really learn. Second, we are the only ones responsible for our decisions. Think of these charts as food for further analysis. Before making a trade, it is important to have a plan. Plan the trade and trade the plan. Among other things, this includes setting a trigger level, a target area and a stop-loss level. It is also important to plan for three possible price movements: advance, decline or sideways. Have a plan for all three scenarios BEFORE making the trade. Consider possible holding times. And finally, look at overall market conditions and sector/industry performance.

About the author:
Arthur Hill, CMT, is the Chief Technical Strategist at TrendInvestorPro.com. Focusing predominantly on US equities and ETFs, his systematic approach of identifying trend, finding signals within the trend, and setting key price levels has made him an esteemed market technician. Arthur has written articles for numerous financial publications including Barrons and Stocks & Commodities Magazine. In addition to his Chartered Market Technician (CMT) designation, he holds an MBA from the Cass Business School at City University in London.
Learn More


