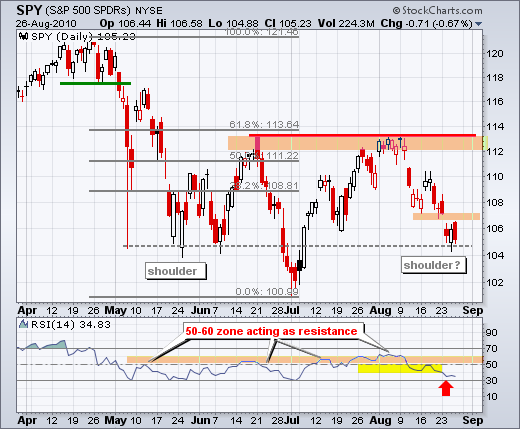
Stocks started the day on firm footing after jobless claims were better-than-expected. However, the morning pop did not last long as SPY moved into negative territory by 11AM. Selling pressure continued throughout the day and the index closed near its lows. Stocks failed to rally on "good" news and this is bad news. Jobless claims were better-than-expected, but the market could not hold its gains. SPY is now down 10 of the last 13 days. Stocks are short-term oversold, but buyers simply lack the muscle in late August. GDP will be reported today. Expectations have been moving lower the last 2-3 weeks so this number may show worse-than-expected growth in the economy. On the price chart, SPY remains with a gap that has yet to be filled. SPY must fill this gap before considering the inverse head-and-shoulders pattern plausible.


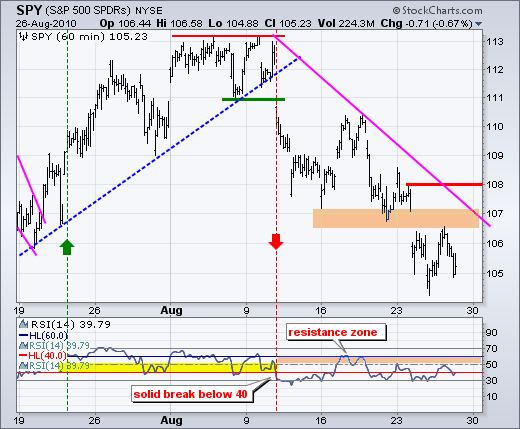
On the 60-minute chart, SPY remains in a clear downtrend, which started with the support break at 111 on August 11th. Most recently, the ETF gapped below 106.5 on Tuesday and then consolidated the last three days. The bulls may take this as evidence of firming. However, firming in a downtrend just means less selling pressure. There is clearly no evidence of buying pressure at the moment. The area around 107 marks the first resistance zone (gap and trendline). I am leaving key resistance at 108 for now. RSI remains in bear mode as long as it trades in the 20-60 zone.

Key Economic Reports:
Fri - Aug 27 - 08:30 - GDP
Fri - Aug 27 - 09:55 - U Michigan Consumer Sentiment
Charts of Interest: Tuesday and Thursday
This commentary and charts-of-interest are designed to stimulate thinking. This analysis is not a recommendation to buy, sell, hold or sell short any security (stock ETF or otherwise). We all need to think for ourselves when it comes to trading our own accounts. First, it is the only way to really learn. Second, we are the only ones responsible for our decisions. Think of these charts as food for further analysis. Before making a trade, it is important to have a plan. Plan the trade and trade the plan. Among other things, this includes setting a trigger level, a target area and a stop-loss level. It is also important to plan for three possible price movements: advance, decline or sideways. Have a plan for all three scenarios BEFORE making the trade. Consider possible holding times. And finally, look at overall market conditions and sector/industry performance.

About the author:
Arthur Hill, CMT, is the Chief Technical Strategist at TrendInvestorPro.com. Focusing predominantly on US equities and ETFs, his systematic approach of identifying trend, finding signals within the trend, and setting key price levels has made him an esteemed market technician. Arthur has written articles for numerous financial publications including Barrons and Stocks & Commodities Magazine. In addition to his Chartered Market Technician (CMT) designation, he holds an MBA from the Cass Business School at City University in London.
Learn More


