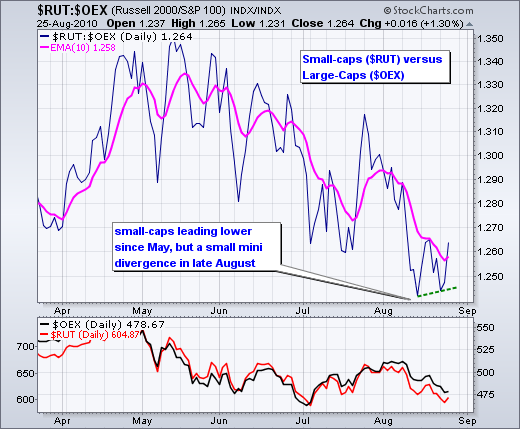
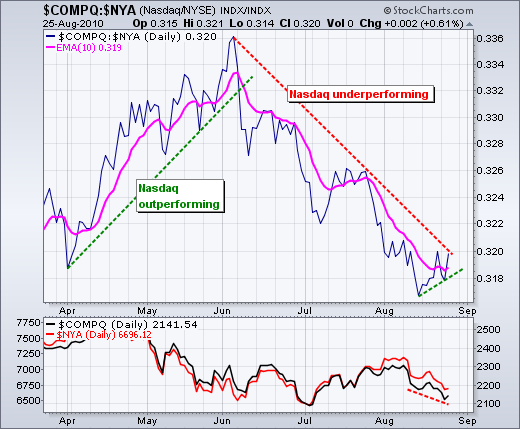
Stocks started the day week, but recovered and closed near the highs for the day. The Dow SPDR (DIA) firmed near its mid July low, the Nasdaq 100 ETF (QQQQ) formed a bullish engulfing near its 62% retracement and the Russell 2000 ETF (IWM) bounced off its early July low. In fact, IWM formed a spinning top on Tuesday and a bullish engulfing on Wednesday. I am also seeing small bullish divergences in the relative performance lines for small-caps and technology. The first chart shows the Russell 2000 relative to the S&P 100. The trend since May is down, which shows relative weakness in small-caps. While both the Russell 2000 and S&P 100 moved to new lows in late August, the price relative formed a higher low over the last two weeks. This small bullish divergence is a start to small-cap outperformance that should be watched closely. The second chart shows the Nasdaq relative to the NY Composite. A small bullish divergence also formed in this price relative over the last two weeks.


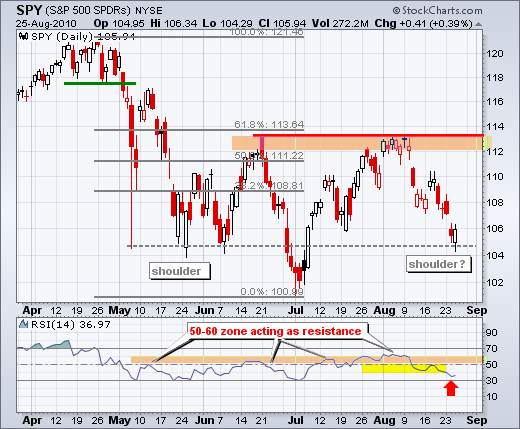
There is not much change on the daily chart. At best, the S&P 500 ETF (SPY) is locked in a trading range with support around 102-105 and resistance around 112-114 or even 118-121. At worst, the overall trend is down after a lower low in July and failure at resistance in early August. It is possible that an inverse head-and-shoulders pattern is taking shape. A move above 108 would fill Tuesday's gap and mark the first step towards a reaction low to form the right shoulder.
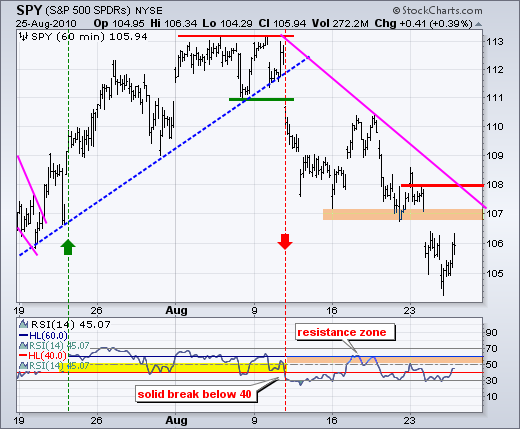
On the 60-minute chart, SPY was way oversold after a move from 113 to 105 (7%) in two weeks. The ETF gapped down on the open Wednesday, but rebounded almost immediately and filled the gap. There is a bigger gap around 106.5 and I am marking the first resistance around 107 from the top of this gap. Overall, I see a resistance zone in the 107-108 area that includes the August trendline. Momentum remains in bear mode as RSI trades in the 20-60 zone. A break above 60 would turn momentum bullish here.
The technical evidence is clearly bearish right now, but I remain concerned with anecdotal evidence of excessively bearish sentiment. Excessively bearish sentiment could give way to a rally. Most recently, I came across a video from Tony Robbins (aka Mr Positive) with a warning on the economy. In its most recent release, AAII bearish sentiment climbed to 49.5% on August 25th.
Key Economic Reports:
Thu - Aug 26 - 08:30 - Jobless Claims
Fri - Aug 27 - 08:30 - GDP
Fri - Aug 27 - 09:55 - U Michigan Consumer Sentiment
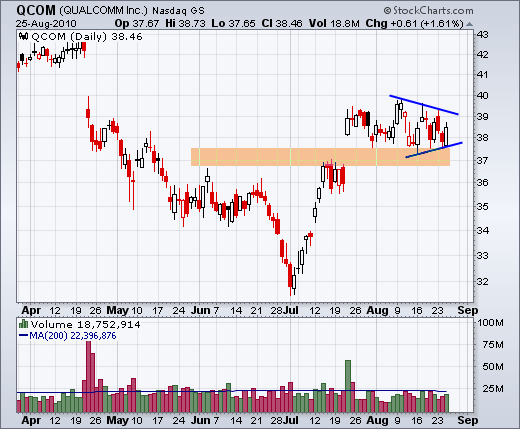
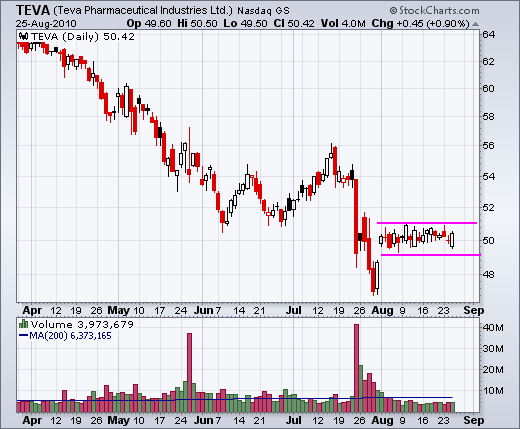
Charts of Interest: ADSK, AMZN, ESRX, MSFT, QCOM, TEVA
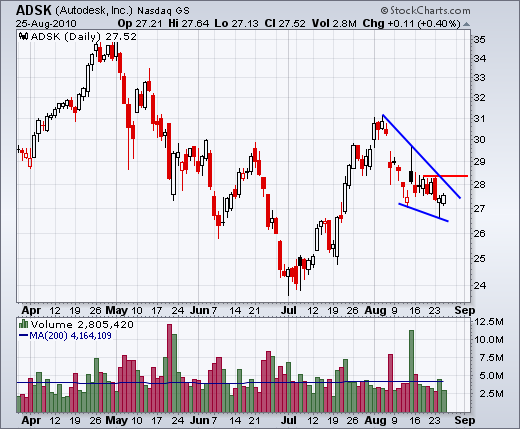
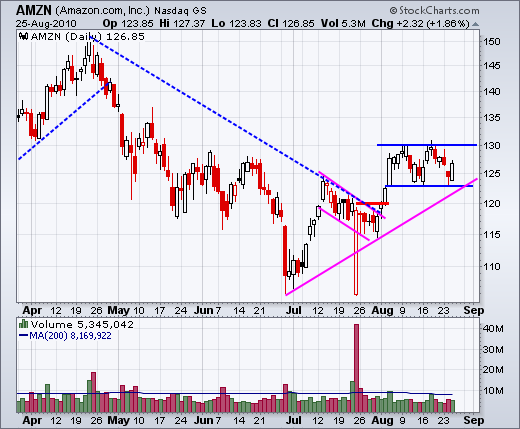
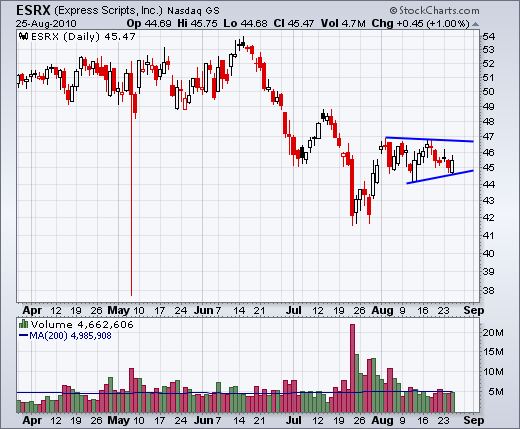
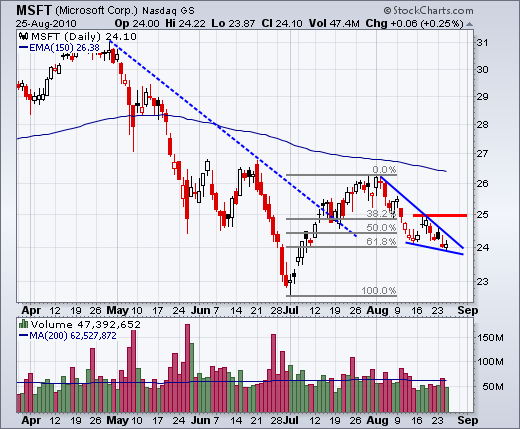
This commentary and charts-of-interest are designed to stimulate thinking. This analysis is not a recommendation to buy, sell, hold or sell short any security (stock ETF or otherwise). We all need to think for ourselves when it comes to trading our own accounts. First, it is the only way to really learn. Second, we are the only ones responsible for our decisions. Think of these charts as food for further analysis. Before making a trade, it is important to have a plan. Plan the trade and trade the plan. Among other things, this includes setting a trigger level, a target area and a stop-loss level. It is also important to plan for three possible price movements: advance, decline or sideways. Have a plan for all three scenarios BEFORE making the trade. Consider possible holding times. And finally, look at overall market conditions and sector/industry performance.

About the author:
Arthur Hill, CMT, is the Chief Technical Strategist at TrendInvestorPro.com. Focusing predominantly on US equities and ETFs, his systematic approach of identifying trend, finding signals within the trend, and setting key price levels has made him an esteemed market technician. Arthur has written articles for numerous financial publications including Barrons and Stocks & Commodities Magazine. In addition to his Chartered Market Technician (CMT) designation, he holds an MBA from the Cass Business School at City University in London.
Learn More


