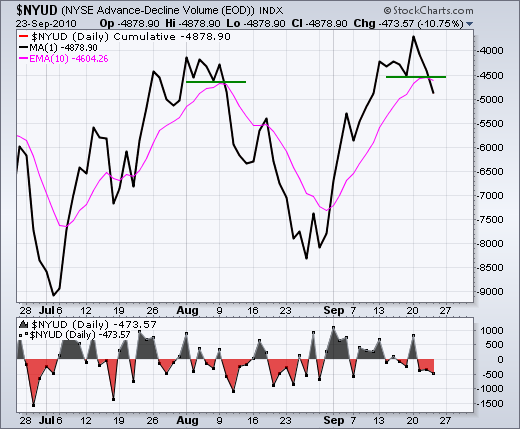
Thursday's action was not encouraging. Stocks started weak as the major index ETFs gapped down on the open. However, the bulls came in almost immediately and pushed stocks into positive territory just after 11AM. Techs led the rebound. This looked encouraging, but selling pressure took hold in the final hour and pushed the major index ETFs to their lows for the day. A weak close and late selling pressure bode ill. Also notice that the finance sector led the way down. So far, the Finance SPDR (XLF) and the Russell 2000 ETF (IWM) failed to confirm the breakouts seen in the S&P 500 ETF (SPY) and Nasdaq 100 ETF (QQQQ). The chart below shows the NYSE AD Volume Line moving below its 10-day SMA and last week's low. It is an early bird sell signal that worked in early August. This is no guarantee, but short-term momentum is shifting towards the bears.


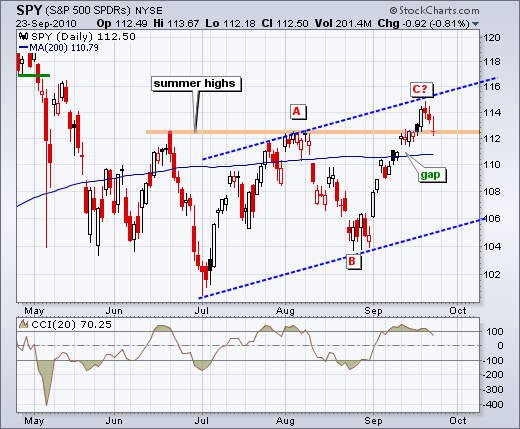
On the daily chart, SPY moved lower the last three days to test short-term support at 112. The breakout above the summer highs is still holding, but just barely. While this breakout still has a chance at success, I am also looking out for the ABC corrective pattern. These patterns are typical after a sharp decline, such as the April-May decline. In addition, notice that the pattern retraced around 62% of the April-May decline and formed a rising wedge. CCI just moved below 100 for the first time since September 7th. The pieces are here for a top, but it could take some time to evolve with the performance anxiety overhang.

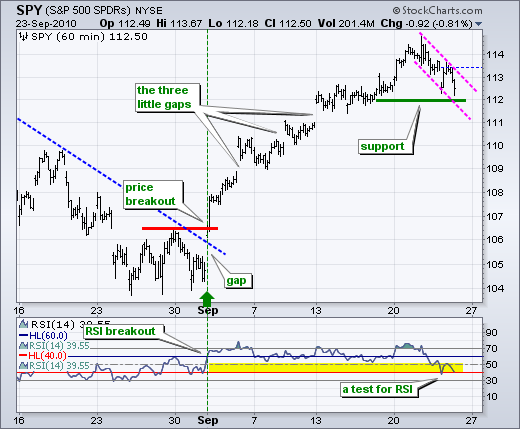
SPY is getting its first pullback test on the 60-minute chart. The ETF declined to support around 112 and RSI is trading in the 40-50 range. A support break for both would be enough to reverse the short-term uptrend. The decline over the last two days looks like a falling flag. Should support at 112 hold, a move above 113.5 would could break flag resistance and signal a continuation of the uptrend.

Key Economic Reports:
Fri - Sep 24 - 08:30 - Durable Orders
Fri - Sep 24 - 10:00 - New Home Sales
Fri - Sep 24 - 10:00 – Fed governors Lacker and Plosser speak
Charts of Interest: Tuesday and Thursday
This commentary and charts-of-interest are designed to stimulate thinking. This analysis is not a recommendation to buy, sell, hold or sell short any security (stock ETF or otherwise). We all need to think for ourselves when it comes to trading our own accounts. First, it is the only way to really learn. Second, we are the only ones responsible for our decisions. Think of these charts as food for further analysis. Before making a trade, it is important to have a plan. Plan the trade and trade the plan. Among other things, this includes setting a trigger level, a target area and a stop-loss level. It is also important to plan for three possible price movements: advance, decline or sideways. Have a plan for all three scenarios BEFORE making the trade. Consider possible holding times. And finally, look at overall market conditions and sector/industry performance.

About the author:
Arthur Hill, CMT, is the Chief Technical Strategist at TrendInvestorPro.com. Focusing predominantly on US equities and ETFs, his systematic approach of identifying trend, finding signals within the trend, and setting key price levels has made him an esteemed market technician. Arthur has written articles for numerous financial publications including Barrons and Stocks & Commodities Magazine. In addition to his Chartered Market Technician (CMT) designation, he holds an MBA from the Cass Business School at City University in London.
Learn More


